You Are On Search Eagle Ford - Texas - Shale (Tight) Oil Play Boom Or Bust Page
Eagle Ford
The USA is 5 % Of The World Population And They Use 25 % (16 to 21 million bbl's - A Day - 14583 bbl's a minute)
Of The Daily World Production (85 to 95 million bbl's - A Day - 66000 bbl's a minute).
What The Eagle
Ford Produces In One Day. 648,445 Barrels - Jan. 2026 - The
USA burns in 44 minutes. The World Burns
in 10 minutes.
(450
bbl's a minute - 648,445 - daily average -
Jan. - 2026 ) Texas Eagle Ford
ProductionTRRC Is Taking Three To Four Months To Update Production Data - Fall 2021 TRRC has switched to some screwed up office app
Based On The Number Of Permits Issued For The Eagle Ford - Give Or Take For Oil or Gas
34,813 Wells According To TRRC (2008 to Jan. - 2026) Texas Eagle Ford Permits
That is an average of 18.6 bbl's of crude oil a day per well. That is 1/10 of a truck load
Note - TRRC Is Always Late In Monthly Production Data Updates & Always Back Dating Numbers
Is The Eagle Ford Peaking?
Return To Index Home Page - bakkenboomorbust.com
A massive year long San Antonio Express-News investigation used the state's own data to show how often a resource
Used to cook, heat homes, produce electricity and fuel vehicles is being squandered.
About the series - In a yearlong investigation published in August 2014, Express-News reporters interviewed dozens of sources,reviewed
thousands of pages of documents and analyzed a database with millions of drilling records to find out the impact of flaring in the Eagle Ford Shale.
Up In Smoke
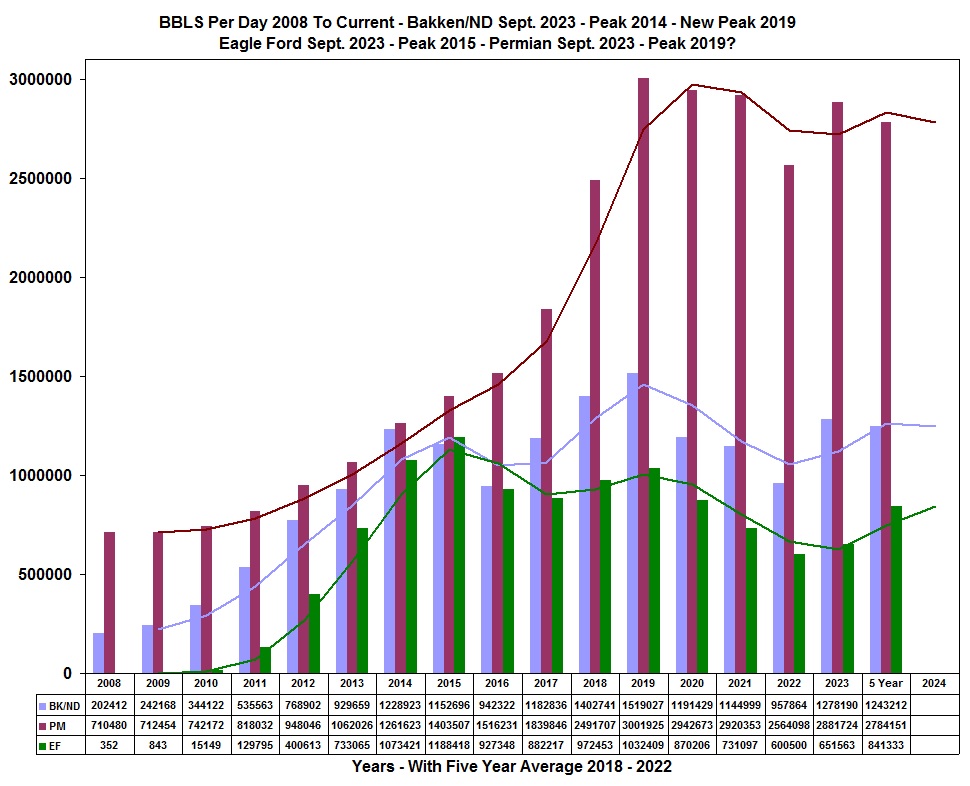
Current Tight Oil Production
Bakken/ND - BK/ND / Permian - PM / Eagle Ford - EF
Texas - State
Baker Hughes Rig Count
2025 daily average 4,652,789 - 2024 daily average 4,715'105
2023 daily average 4,465,422 - 2022 daily average 4,896,102 - 2021 daily average 4,773,984 - 2020 daily average 4,090,551 -
2019 daily average 4,347,461 - 2018 daily average 3,752,215 - 2017 daily average 3,041,345 - 2016 daily average 2,757,666 -
2015 daily average 2,939,200 - 2014 daily average 2,687,388 - 2013 daily average 2,137,561 - 2012 daily average 1,665,357
Monthly production totals of crude oil, condensate, total oil, well gas, casing head gas, and total natural gas.
Texas TRRC - Monthly - Production
Note - TRRC Is Always Late In Monthly Production Data Updates & Always Back Dating Numbers
EIA - Texas Current Production
toggle moving average for data - inaccurate number for production - TRRC shows a lot less
I wanna hold 'em like they do in Texas plays
Fold 'em, let 'em, hit me, raise it, baby, stay with me (I love it)
Poker Face
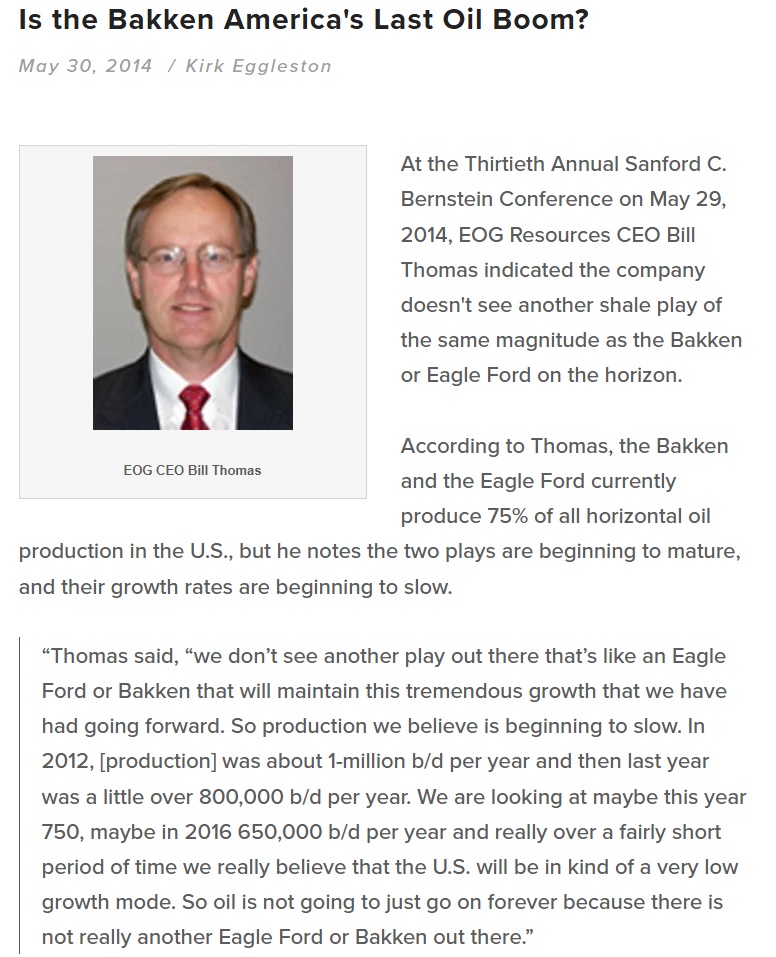
The Great American Oil Boom, which he helped create, is "not going to be as massive as people think."
The chances of the USA being independent in oil are very slim, Mark Papa former CEO of EOG Resources
The Fracking Bubble.
"There is no next big horizontal play waiting in the wings to follow the Bakken and Eagle Ford." EOG, CEO.
There Is No Act Three
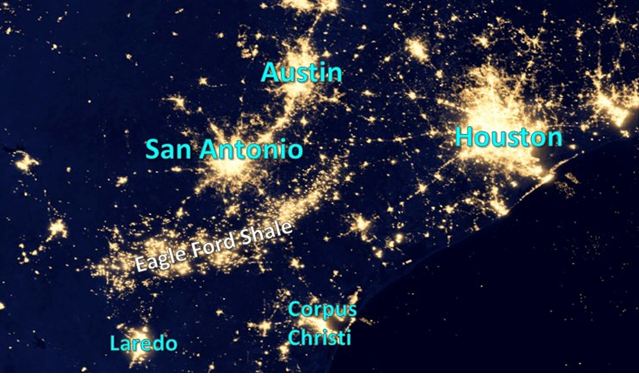
Eagle Ford From Outer Space
Need for clarification. In a lot of articles published on the net and paper. Stated production numbers from both plays that do not add up.
Such as . Eagle Ford making 2.3 million bbl's". Look to the state agency that count's the eagle ford, Texas production.
| TRRC - Texas
Railroad Commission |

Question Is

Eagle Ford - Texas TRRC - EIA - Decline - Production - Price - Chart
We're setting sail To the place on the map from which no one has ever returned
Drawn by the promise of the joker and the fool By the light of the crosses that burn
Oh, save me. Save me from tomorrow I don't want to sail with this ship of fools
Ship Of Fools
Return To Index Home Page - bakkenboomorbust.com
To the fullest extent of the law, we will not be liable to any person or entity for the quality, accuracy, completeness, reliability, or timeliness of the information provided on this website,
or for any direct, indirect, consequential, incidental, special or punitive damages that may arise out of the use of information we provide to any person or entity
(including, but not limited to, lost profits, loss of opportunities, trading losses, and damages that may result from any inaccuracy or incompleteness of this information).
We encourage you to invest carefully and read investment information available at the websites of the SEC at http://www.sec.gov and FINRA at http://www.finra.org.
IF YOU DO NOT AGREE
WITH THE TERMS OF THIS DISCLAIMER, PLEASE EXIT THIS SITE
IMMEDIATELY. PLEASE BE ADVISED THAT YOUR CONTINUED USE
OF THIS SITE
OR THE INFORMATION PROVIDED HEREIN SHALL INDICATE YOUR
CONSENT AND AGREEMENT TO THESE TERMS.

Honor - Respect - Freedom - Country
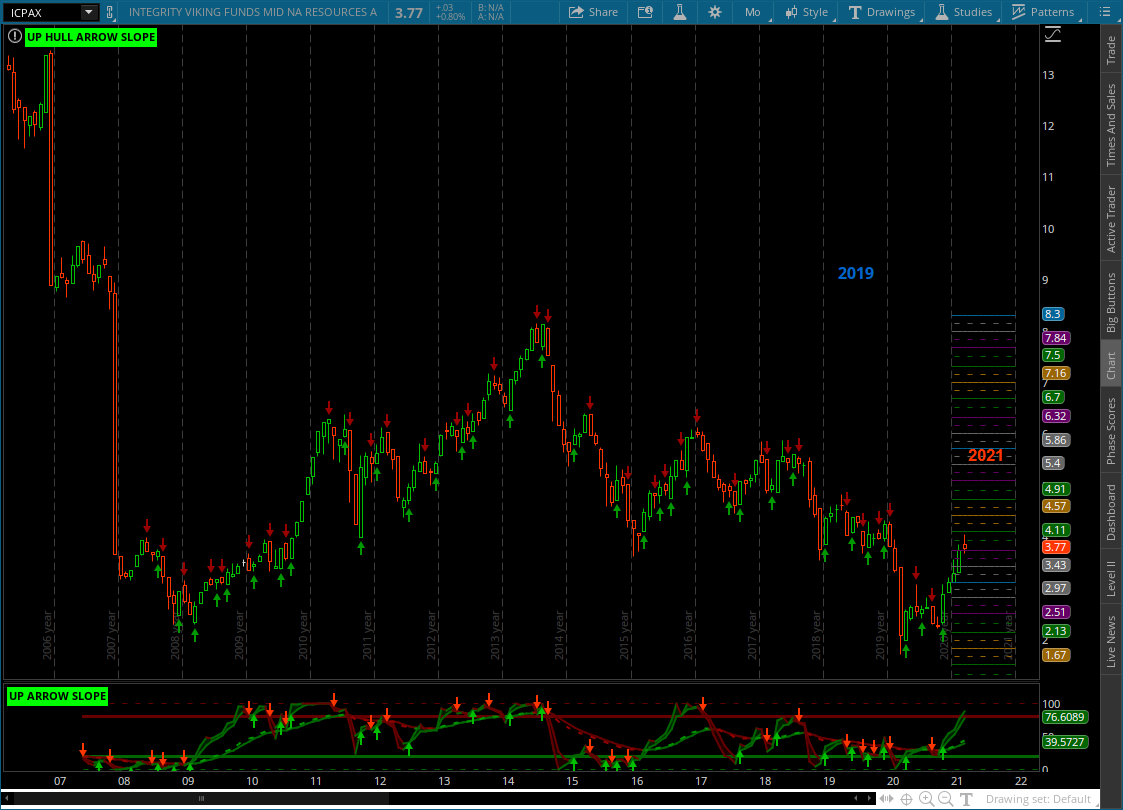
ICPAX - Williston Basin Stock Fund