You Are On Search Bakken / North Dakota Real Estate Boom Or Bust Page
| This Page's
Layout Guide L to R - Top To Bottom |
Building Permits | Cumulative
Permits |
Residential Units For Sale |
Commercial Units For Sale |
Equity Debt Bubbles |
| Minot $212 + Million In Equity Debt |
Dickinson $113 + Million In Equity Debt |
Williston $300 + Million In Equity Debt |
Bismarck $222 + Million In Equity Debt |
Fargo $693 + Million In Equity Debt |
Mandan $72 + Million In Equity Debt |
| Watford
City $300 + Million In Equity Debt |
Newtown | Stanley | Tioga | Bottineau | Kenmare |
| Belfield | Bakken
Equity Debt Loans |
UVL Movers Study |
How Much Equity Debt ? |
Equity
Investor Beware - NDDG |
Equity Property
Tax Viewer |
"The problem with Socialism is that eventually you run out of other people's money.” Margaret Thatcher
With "New Bold Leadership In The White House And In Bismarck" The Numbers Can Only Get Better
The Phrase Was Coined By Former North Dakota GOP Governor Doug Burgum - The Only Candidate For Governor To Endorse Trump
April 2018 - Governor Calls For More Budget Cuts - What He Should Call For Is The Cut Of The Waste Of Money In The Taxpayers Equity Govt!
They Have & Need To Raise Property & Sales Taxes More - So They Don't Touch The Billions In The Common School's Fund & Legacy Fund
North Dakota Tax Gimmicks
Equity Is Used In It's Definition - The Quality Of Being Fair & Impartial & The Value Of That Fairness & Impartiality - As In Well Managed Business Equity Debt - As In Well Managed Public Equity Debt Created By
Local, State & Federal Leaders. The Democracy That Gives Taxpayers A Say In That Equity Debt. As In New Airports, New Public Structures, New Schools, New Jails, Healthcare, Law Enforcement, Addiction Recovery,
Tax Reduction, Private Investing, More Government & Bureaucrat Waste. Thank God For Bold New Leadership That Is Of A Equity State Of Mind.
No More Money Squanders, No More Career Politicians, No More Good Old Boys, No More Tilting At Windmills Whose Foundations Are Anchored In Swamps.
Just then they came in sight of thirty or forty windmills that rise from that plain. And no sooner did Don Quixote see them that he said to his squire,
"Fortune is guiding our affairs better than we ourselves could have wished. Do you see over yonder, friend Sancho, thirty or forty hulking giants?
I intend to do battle with them and slay them. With their spoils we shall begin to be rich for this is a righteous war
and the removal of so foul a brood from off the face of the earth is a service God will bless."
As A Human & Or An Investor One Should Always Do Due Diligence To Protect Oneself - One Should Always Do Vetting Before Living Or Investing - Not Hype
One Can Only Interpret The Unknown Right Hand Side Of The Chart By Gageing The Known Left Hand Side
If you tell the truth, you don't have to remember anything. - Mark Twain
Return To Index Home Page - bakkenboomorbust.com
If You Want Something You Never Had - You Must Be Willing To Do Something You've Never Done - Thomas Jefferson
| Building
Permits Return To Top Of Page |
| Source - hudser.org | Source - US Census Bureau |
hudser.org Is Forever Slow To Update Monthly & Annual Data - census.gov Is Updated Monthly For Most Locations - Some Locations Are Only Annual Numbers
All Numbers Are Actual Numbers From The Fed As The Final Reporting Data Source & Minor Tweaks As Updated
The Numbers From hudser.org & census.gov Speak Volumes - Like The Lady Said " Show Me A Chart & I'll Tell You The Story"
Bakken Single Family Permits - 2005 to Current
Years PEAK - Minot 2012 M - Williston 2011 W - Dickinson 2012 D - Bismarck 2013 B - Mandan 2012 M - Watford City 2014 W - Gross Total 2012 G
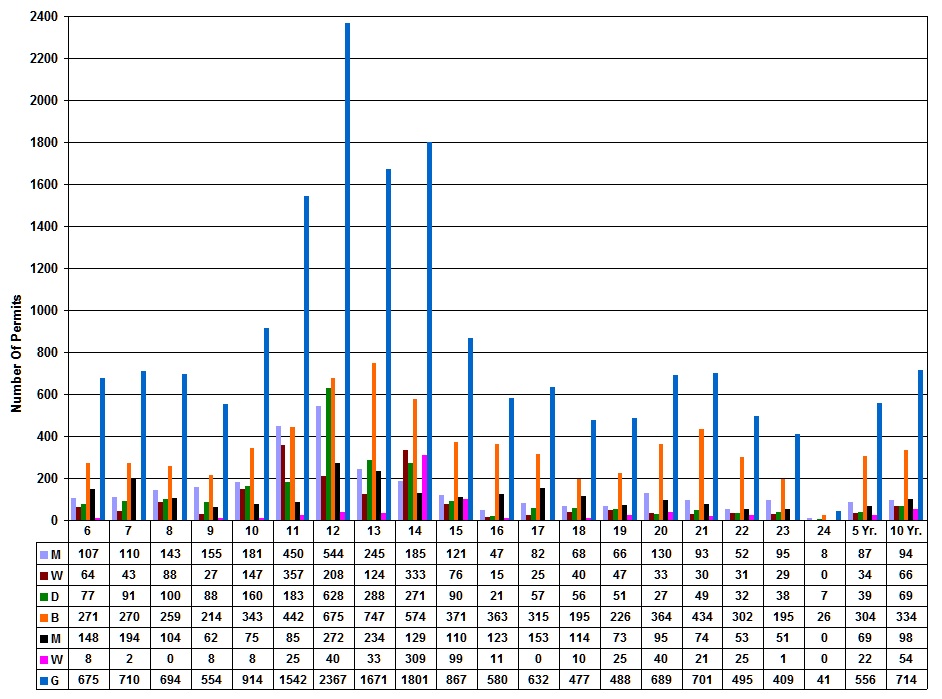
Years - With Five Year Average 2021 - 2025 - Ten Year 2016 - 2025
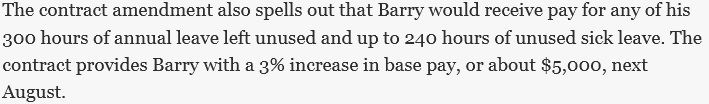
Bakken Multi Family Permits - 2005 to Current
Years PEAK - Minot 2013 M - Williston 2013 W - Dickinson 2012 D - Bismarck 2014 B - Mandan 2013 M - Watford City 2014 W - Gross Total 2014 G
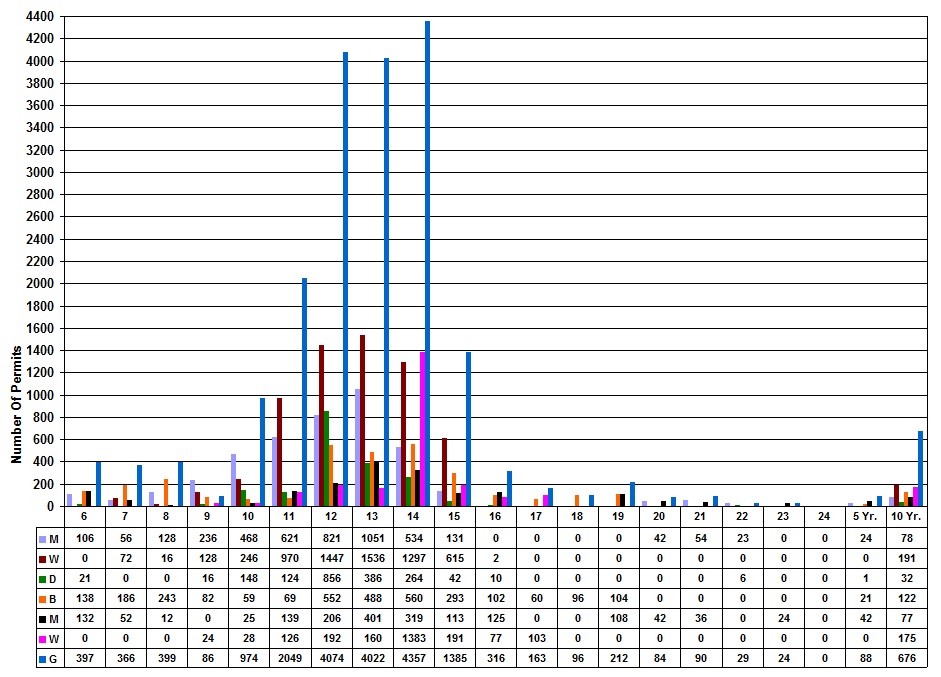
Years - With Five Year Average 2021 - 2025 - Ten Year 2016 - 2025
| Cumulative Building
Permits Return To Top Of Page |
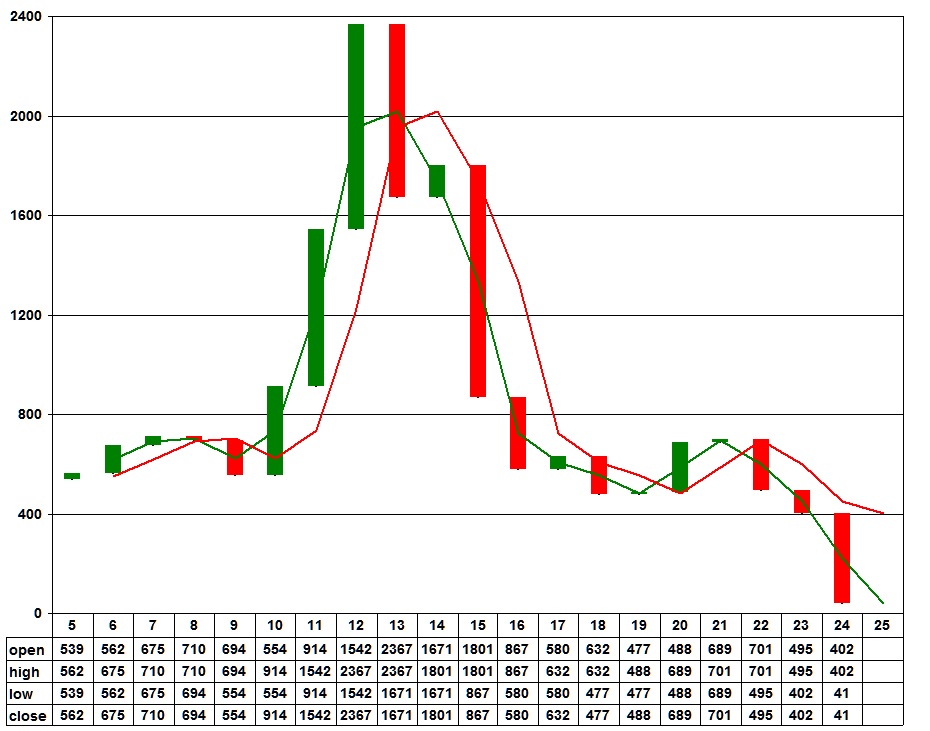
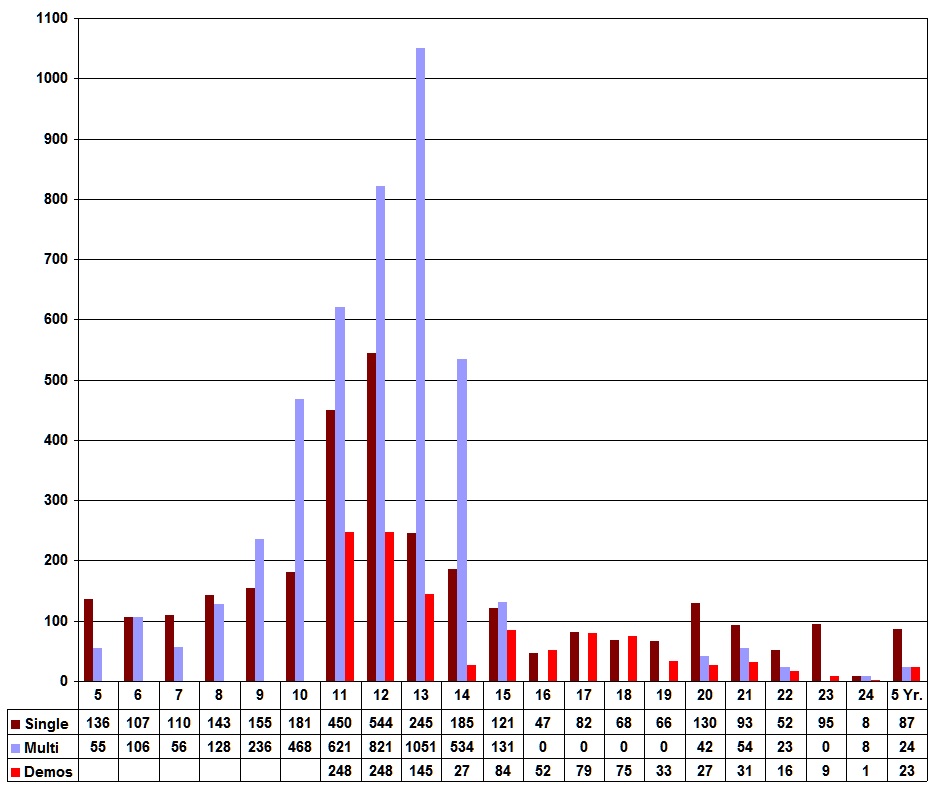
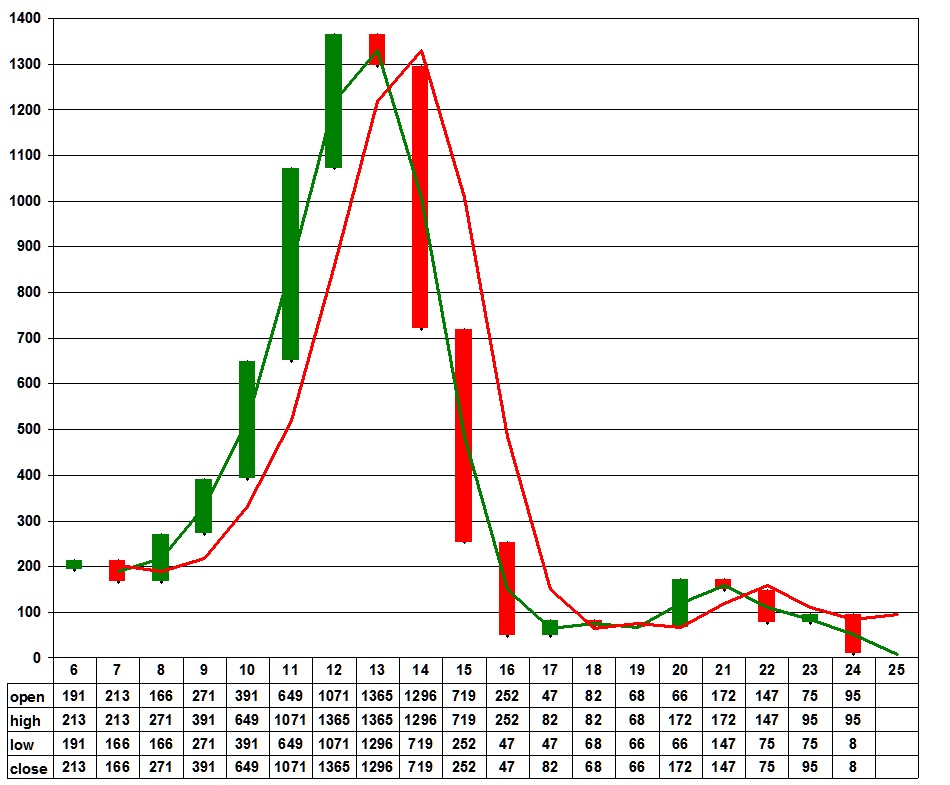
Bakken Single Family Permits - 2005 to Current
Cumulative Of - Minot - Williston - Dickinson - Bismarck - Mandan - Watford City
YOY 2013-2014 Down 29% - YOY 2014-2015 Up 8% - YOY 2015-2016 Down 52% - YOY 2016-2017 Down 33%
YOY 2017-2018 Up 8% - YOY 2018-2019 Down 25% - YOY 2019-2020 Up 2% - YOY 2020-2021 Up 29%
YOY 2021-2022 Up 1% - YOY 2022-2023 Down 29% - YOY 2023-2024 Down 19% - YOY 2024-2025 Up 14%
YOY 2025-2026 Up 12% - YOY 2026-2027 Down 68%
Number Of Permits - Time Frame One Year Candles
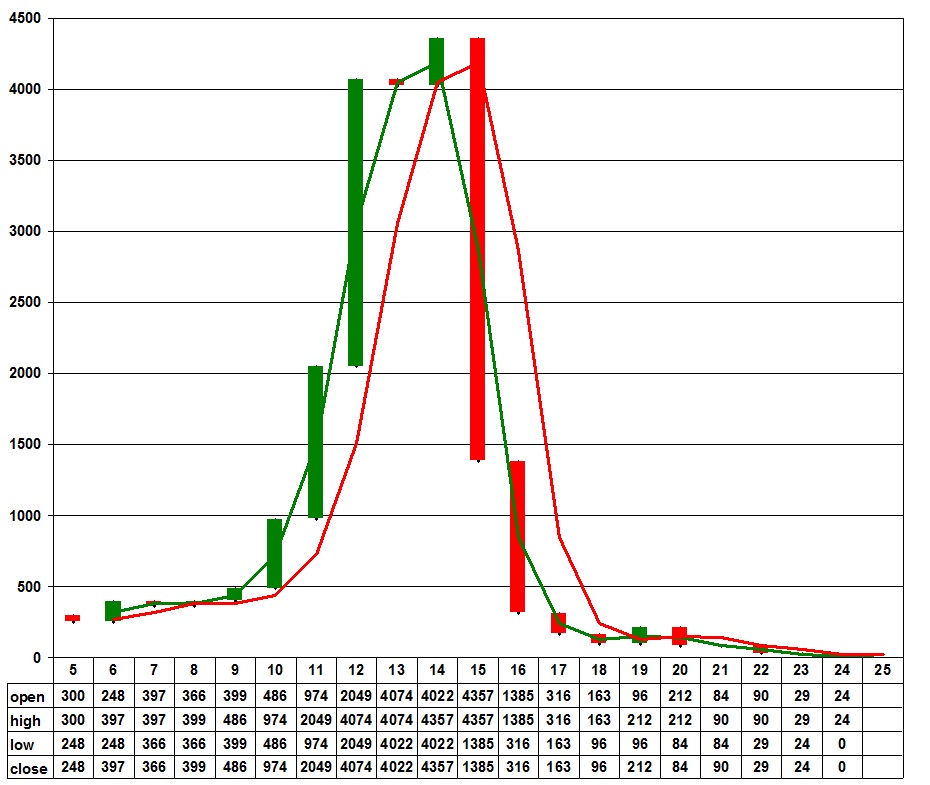
Bakken Multi Family Permits - 2005 to Current
Cumulative Of - Minot - Williston - Dickinson - Bismarck - Mandan - Watford City
YOY 2013-2014 Down 1% - YOY 2014-2015 Up 7% - YOY 2015-2016 Down 68% - YOY 2016-2017 Down 77%
YOY 2017-2018 Down 48% - YOY 2018-2019 Down 42% - YOY 2019-2020 Up 55% - YOY 2020-2021 Down 60%
YOY 2021-2022 Up 6% - YOY 2022-2023 Down 71% - YOY 2023-2024 Down 100% - YOY 2024-2025 Up 87%
YOY 2025-2026 Down 43% - YOY 2026-2027 Down 100%
Number Of Permits - Time Frame One Year Candles
| What Are
Candlesticks |
The Master | Camarila Pivots | Cam Calculator |
| Residential
Units For Sale Return To Top Of Page |
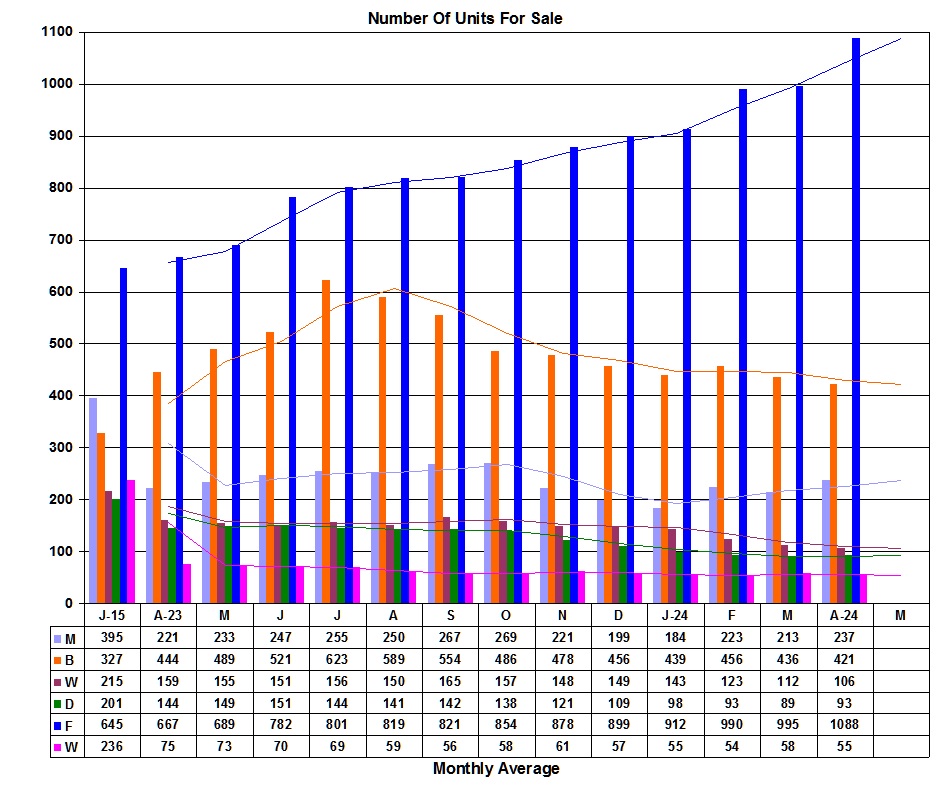
Western Bakken Cities on realtor.com Units For Sale
Data Is From realtor.com
“This is a temporary hurdle, and eventually (oil) prices go back up. It’s a question of when and how much and the rate,” he said.
“It’s not this sense that people are heading out the door.” ND To 800,000 by 2020 Kevin Iverson, manager of the North Dakota Census Office
Fargo Is Revised To 228,000 In This Story Continued Growth
| Minot Population 47700 |
Bismarck Population 74400 |
Williston Population 27000 |
Dickinson Population 25000 |
Watford City Population 5885 |
You Will Have To Select 1 More Filter To Choose Miles
| Minot On realtor.com |
Bismarck On realtor.com |
Williston On realtor.com |
Dickinson On realtor.com |
Fargo On realtor.com |
Watford City On realtor.com |
12 Month Moving Average - Data Is 25 Miles Of Each City
Data Is Updated Mid Month - Single Family - Condo - Townhouse - MFD Mobile Home
Permits Are Decreasing - Units For Sale Are Increasing - Sign Of A Bust Not A Boom
Fargo is Added To Give Reference In Comparison To The Number Of Properties For Sale In The Bakken Cities
Compared To A Area With A Population Of Some 223,000 People Fargo Population
2013 Census - Minot 46000 - Bismarck 67000 - Williston 20850 - Dickinson 26000 - Watford City 3000
Buyer Beware - FEMA Has Redrawn Flood Zones In Minot June 2017 - Vanishing Minot - Insurance & FEMA
Minot M+25 - Bismarck B+25 - Williston W+25 - Dickinson D+25 - Fargo F+25 - Watford City W+25 - January 2015 - Is Kept As The Low Water Mark
Bismarck & Fargo Numbers Have Increased With The State Budget Deficit
| Commercial
Units For Sale Return To Top Of Page |
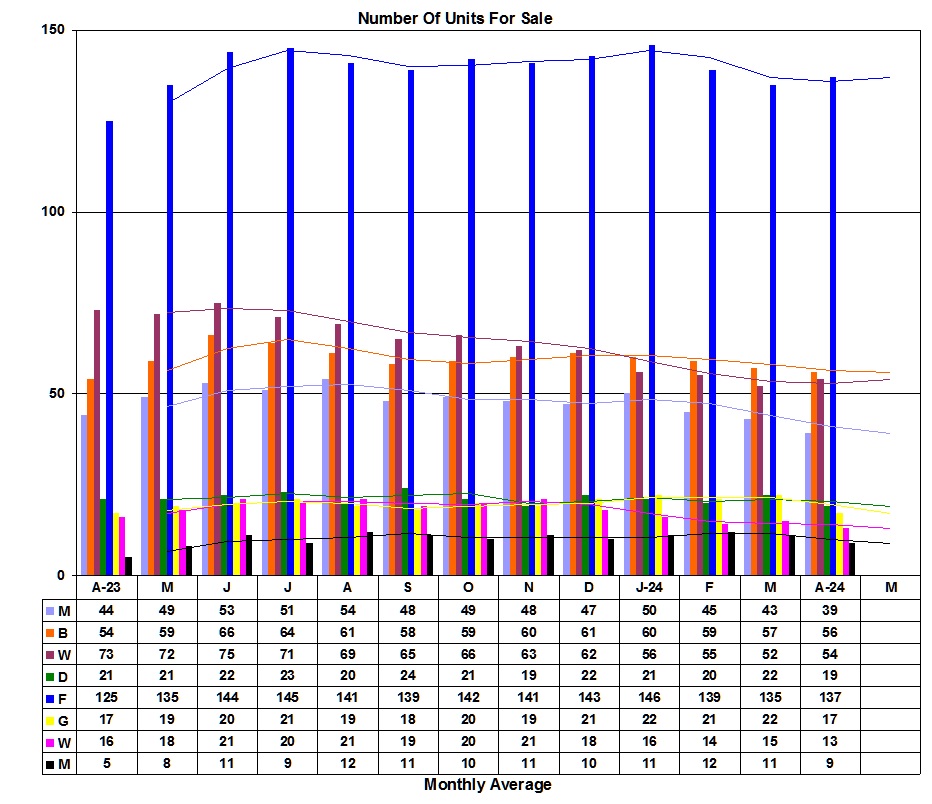
12 Month Moving Average - Commercial Properties
Data Is From loopnet.com - Data Is Updated Mid Month
| Minot On
loopnet.com |
Bismarck On loopnet.com | Williston On loopnet.com | Dickinson On loopnet.com |
| Fargo On loopnet.com | Grand Forks On loopnet.com | Watford City On loopnet.com | Mandan On loopnet.com |
Buyer Beware - FEMA Has Redrawn Flood Zones In Minot June 2017 - Vanishing Minot Link - Insurance & FEMA
Minot M - Bismarck B - Williston W - Dickinson D - Fargo F - Grand Forks G - Watford City W - Mandan M
| Equity
Debt Bubbles -
Walk Away Return To Top Of Page |
| Real Estate Equity Debt Bubbles | USA Housing Market Correction |
The Greatest Bubble So Far |
The Shale Bubble |
Is Subprime Money In The Bakken
| USDA Leads The Charge | USDA Loan Program |
Economic Bubble |
Subprime Lending |
Current Fed Delinquency Rate On Single Family Residential Mortgages
St.Louis Fed
When It All Fails - Strategic Equity Default
| Walk Away Calculator as cached on way back machine - youwalkaway.com |
You Walk Away as cached on way back machine - youwalkaway.com |
What Was youwalkaway.com Strategic Default |
The 12 Months Of Default
xmas classic of the mortgage bust
If you have hard time understanding what happened in 2007 - 2008 & is still happening today with mortgages watch the movie "The Big Short"
The Banks went out of their way to help you into a house & bet big to help you out of a house,
For in the end the FED is the ultimate underwriter of all mortgages and they let this go on and still goes on.
The FED purchased with fiat money - equity debt - from 2009 to 2014 $1.75 trillion in bad equity debt mortgage paper.
The Congress bailed out the banks and the FED bought their bad equity debt paper, What A Deal!
The FED

Capital Isn’t Exactly Flowing Freely Into Developing Bakken Communities,
Big Lenders Wary Of Following Oil Money To North Dakota
"Here’s a shocking statistic showing just how temporary the housing boom in western North Dakota may be.
Data about home-building permits suggests workers are still keen to rent apartments rather than invest in housing and settle down.
Only 20 permits were granted in Williston [for single-family homes] during the first five months of this year,
compared to permits to build 482 apartment units,according to the city’s building department.
As recently as 2010 the number of home building permits in Williston, a city of about 16,000, far outpaced apartment permits."
| Is Bakken
Housing Boom A Bubble |
Is The
Hotel Bubble Collapsing |
Yet Statewide Assistance Is Needed |
| Minot Return To Top Of Page |
Link To City Of Minot Building Permits - Minot Building Permits - MOM
The Real Fact - In the spring of 2011 the residents below these three dam's had no idea and were never told of the ticking time bomb of water above them.
They were in harm's way and a storm of bureaucracy on both sides of the border left them to unmanaged volatility of the Souris River not seen since 1976
The Dam's Were Not Just Full - They Were At Dangerous Above Full Level's In April Of 2011- Vanishing Minot - Facts & Rumors
Minot Isn't Vanishing Because of the 2011 Flood
Minot is Vanishing Because of Flood Control & Taxes - Vanishing People, Property, & Money
Buyer Beware - FEMA Has Redrawn Flood Zones In Minot June 2017 - Vanishing Minot - Insurance & FEMA
| Minot On realtor.com | Minot - Taxpayer City Equity Debt | Minot On loopnet.com |
Minot - Single - Multi - Demo - Family Building Permits
Minot Is On Track To Have Demoed More Single Family Homes Then New Ones That Are Built - Four Years In A Row - 2016 - 2017 - 2018 - 2019
Minot Has Not Seen A Increase Of Single Family Homes Since 2013 - They Keep Demolishing Them & Raising Property Taxes
2016 - 2017 - 2018 - 2019 - The First Years In 37 & 38 & 39 & 40 Years - No Apartments Are Built
Number Of Permits 2005 To Current
With Five Year Average 2021 - 2025
NDRC Application March 6th 2015 Page 18 - States That 805 Homes Were Destroyed By The 2011 Flood
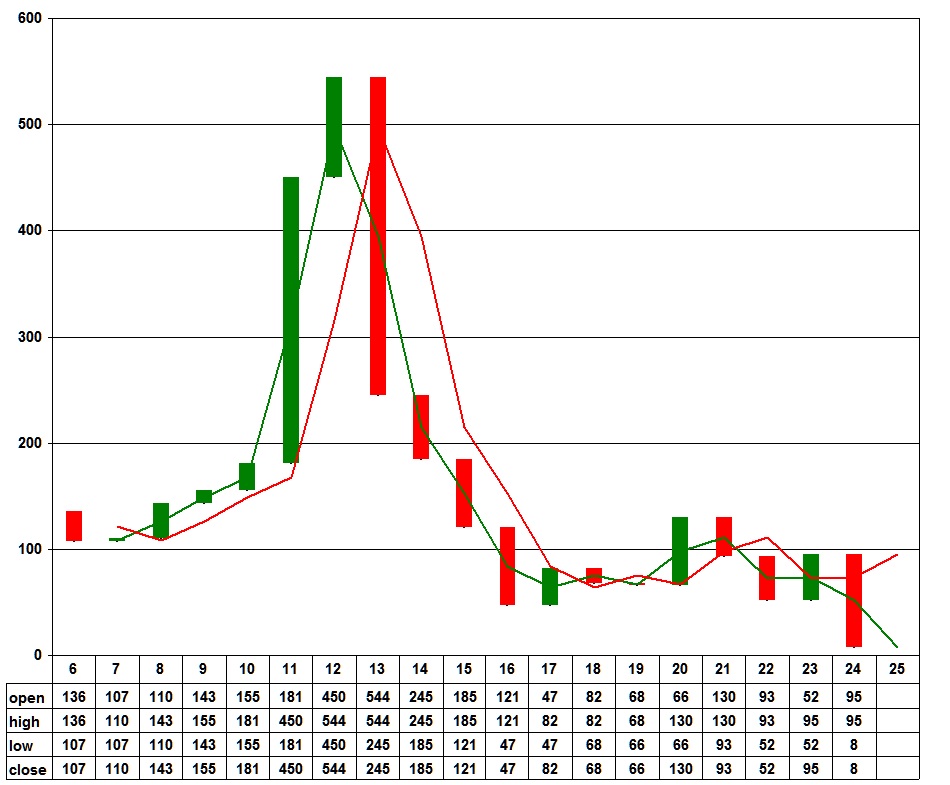
Minot Single Family Permit Numbers From 1980 To 2019 - New Highest Number Was 136 Permits In 2005
The Previous High Was 133 In 1983 - The Bust Of The Last Oil Boom Deja Vu - 1982
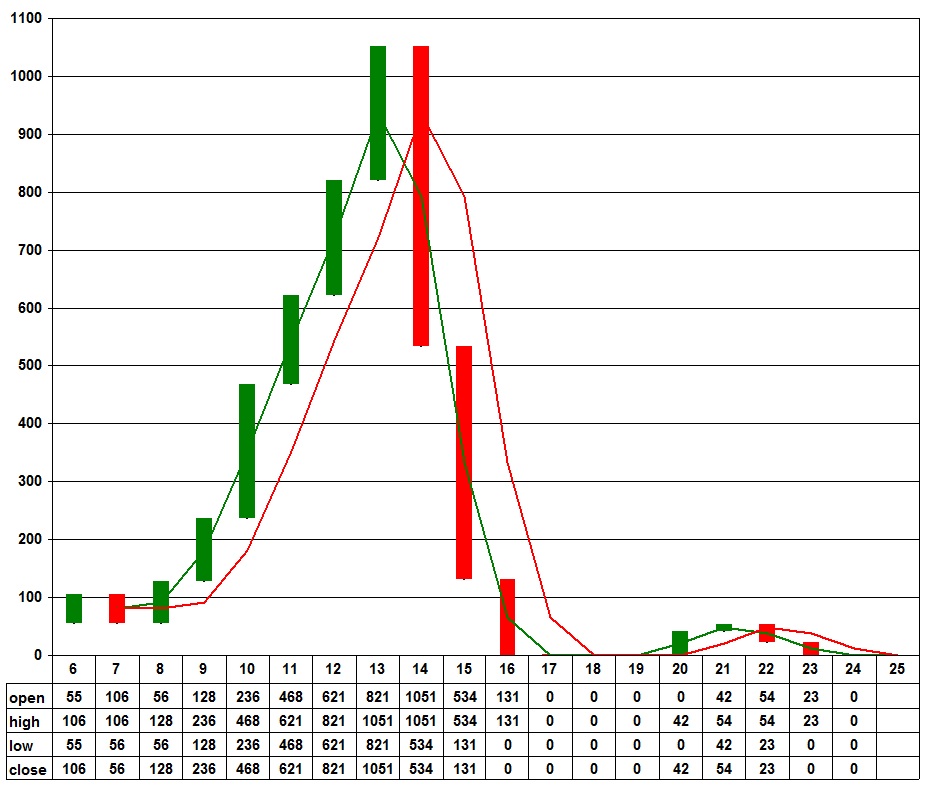
Minot Multi Family Permit Numbers From 1980 To 2019 - New Highest Number Was 468 Units In 2010
The Previous High Was 370 Units In 1983 - The Bust Of The Last Oil Boom Deja Vu - 1982
1980 to 2026 - 46 Year Total Annual Mean Average Is 248 Units
1983 Bust to 2005 Boom - 22 Year Total Annual Mean Average Is 163 Units
2005 Boom to 2015 Bust - 11 Year Total Annual Mean Average Is 599 Units
Subtract the (-1,092) Demoed Single Family Homes & Minot Has Not Seen A Increase In New Single Family Homes Since 2013
Minot Annual Numbers - 2020 - 2039
| 2020
- 2039 - Housing Unit Building Permits for: MINOT, ND
(Ward County) 2005
Clean Water Act Changed |
|||||||||||||||||||||
|---|---|---|---|---|---|---|---|---|---|---|---|---|---|---|---|---|---|---|---|---|---|
| Year |
2020 | 2021 | 2022 | 2023 | 2024 | 2025 | 2026 | 2027 | 2028 | 2029 | 2030 | 2031 | 2032 | 2033 | 2034 | 2035 | 2036 | 2037 | 2038 | 2039 |
Total |
| Total | 172 |
147 |
75 |
95 |
86 |
96 |
37 |
708 |
|||||||||||||
| Single | 130 |
93 |
52 |
95 |
86 |
60 |
37 |
553 |
|||||||||||||
| Multi | 42 |
54 |
23 |
0 |
0 |
36 |
0 |
155 |
|||||||||||||
| Demo's |
-27 |
-31 |
-16 |
-9 |
-8 |
-10 |
0 |
-101 |
|||||||||||||
| 2000
- 2019 - Housing Unit Building Permits for: MINOT, ND
(Ward County) 2005
Clean Water Act Changed |
|||||||||||||||||||||
|---|---|---|---|---|---|---|---|---|---|---|---|---|---|---|---|---|---|---|---|---|---|
| Year |
2000 | 2001 | 2002 | 2003 | 2004 | 2005 | 2006 | 2007 | 2008 | 2009 | 2010 | 2011 | 2012 | 2013 | 2014 | 2015 | 2016 | 2017 | 2018 | 2019 |
Total |
| Total | 162 | 92 | 135 | 120 | 163 | 191 | 213 | 166 | 271 | 391 | 649 | 1071 | 1365 | 1296 | 719 | 252 | 47 | 82 | 68 |
66 |
7467 |
| Single | 64 | 59 | 66 | 68 | 69 | 136 | 107 | 110 | 143 | 155 | 181 | 450 | 544 | 245 | 185 | 121 | 47 | 82 | 68 |
66 |
2966 |
| Multi | 46 | 33 | 69 | 52 | 94 | 55 | 106 | 56 | 128 | 236 | 468 | 621 | 821 | 1051 | 534 | 131 | 0 | 0 |
0 |
0 |
4501 |
| Demo's |
-248 |
-248 |
-145 |
-27 |
-84 |
-52 |
-79 |
-75 |
-33 |
-991 |
|||||||||||
| 1980 - 1999 - Housing Unit Building Permits for: MINOT, ND (Ward County) | |||||||||||||||||||||
|---|---|---|---|---|---|---|---|---|---|---|---|---|---|---|---|---|---|---|---|---|---|
| Year |
1980 | 1981 | 1982 | 1983 | 1984 | 1985 | 1986 | 1987 | 1988 | 1989 | 1990 | 1991 | 1992 | 1993 | 1994 | 1995 | 1996 | 1997 | 1998 | 1999 |
Total |
| Total | 162 | 85 | 129 | 503 | 270 | 149 | 118 | 194 | 42 | 57 | 32 | 50 | 120 | 142 | 329 | 241 | 163 | 221 | 168 | 174 |
3349 |
| Single | 97 | 57 | 38 | 133 | 86 | 73 | 50 | 79 | 29 | 21 | 26 | 48 | 78 | 95 | 122 | 116 | 95 | 88 | 101 | 89 |
1521 |
| Multi | 65 | 28 | 91 | 370 | 184 | 76 | 68 | 115 | 13 | 36 | 6 | 2 | 42 | 47 | 207 | 125 | 68 | 133 | 67 | 85 |
1828 |
Minot Single Multi Family Permits Combined - 2006 to Current
With "New Bold Leadership In The White House And In Bismarck" The Numbers Can Only Get Better
The Phrase Was Coined By Former North Dakota GOP Governor Doug Burgum - The Only Candidate For Governor To Endorse Trump
The Current Permit Count Of 2026 Goes Back To The Low Of 1990
2016 - 2017 - 2018 - 2019 - The First Years In 37, 38, 39 & 40 Years - No Apartments Are Built
Number Of Permits - Time Frame One Year Candles
YOY 2013-2014 Single Down 65% - YOY 2014-2015 Single Down 24% - YOY 2015-2016 Single Down 35% - YOY 2016-2017 Single Down 61%
YOY 2017-2018 Single Up 43% - YOY 2018-2019 Single Down 17% - YOY 2019-2020 Single Down 3% - YOY 2020-2021 Single Up 40%
YOY 2021-2022 Single Down 29% - YOY 2022-2023 Single Down 45% - YOY 2023-2024 Single Up 45% - YOY 2024-2025 Single Down 9%
YOY 2025-2026 Single Down 30%
YOY 2026 - 2027 - 5 Months Single Family Permits Down 6 Units
YOY 2013-2014 Multi Up 23% - YOY 2014-2015 Multi Down 49% - YOY 2015-2016 Multi Down 75% - YOY 2016-2017 Multi Down 100%
YOY 2017-2018 Multi Down 131% - YOY 2018-2019 Multi Down 0% - YOY 2019-2020 Multi Down 0% - YOY 2020-2021 Multi Down 0%
YOY 2021-2022 Multi Up 20% - YOY 2022-2023 Multi Down 59% - YOY 2023-2024 Multi Down 0% - YOY 2024-2025 Multi Down 0%
YOY 2025-2026 Multi Up 36%
YOY 2026 - 2027 - 5 Months Multi Family Permits Up 0 Units
See Cumulative Charts At Top Of Page For YOY Percentage Of Bakken Building Permits - The Numbers & Charts Pretty Much Tell The Story
Minot 2026
| Housing Unit Building Permits for: MINOT, ND (Ward County) 2005 Clean Water Act Changed | |||||||||||||
|---|---|---|---|---|---|---|---|---|---|---|---|---|---|
| Month Year |
Jan. 2026 |
Feb. 2026 |
Mar. 2026 |
Apr. 2026 |
May 2026 |
June 2026 |
July 2026 |
Aug. 2026 |
Sep. 2026 |
Oct. 2026 |
Nov. 2026 |
Dec. 2026 |
Total 2026 |
| Total | 3 |
0 |
3 |
11 |
20 |
37 |
|||||||
| Single |
3 |
0 |
3 |
11 |
20 |
37 |
|||||||
| Multi |
0 |
0 |
3 |
0 |
0 |
0 | |||||||
| Housing Unit Building Permits for: MINOT, ND (Ward County) 2005 Clean Water Act Changed | |||||||||||||
|---|---|---|---|---|---|---|---|---|---|---|---|---|---|
| Month Year |
Jan. 2025 |
Feb. 2025 |
Mar. 2025 |
Apr. 2025 |
May 2025 |
June 2025 |
July 2025 |
Aug. 2025 |
Sep. 2025 |
Oct. 2025 |
Nov. 2025 |
Dec. 2025 |
Total 2025 |
| Total | 3 |
0 |
4 |
5 |
19 |
4 |
3 |
3 |
3 |
10 |
40 |
2 |
96 |
| Single |
3 |
0 |
4 |
5 |
19 |
4 |
3 |
3 |
3 |
10 |
4 |
2 |
60 |
| Multi |
0 |
0 |
0 |
0 |
0 |
0 |
0 |
0 |
0 |
0 |
36 |
0 |
36 |
| Housing Unit Building Permits for: MINOT, ND (Ward County) 2005 Clean Water Act Changed | |||||||||||||
|---|---|---|---|---|---|---|---|---|---|---|---|---|---|
| Month Year |
Jan. 2024 |
Feb. 2024 |
Mar. 2024 |
Apr. 2024 |
May 2024 |
June 2024 |
July 2024 |
Aug. 2024 |
Sep. 2024 |
Oct. 2024 |
Nov. 2024 |
Dec. 2024 |
Total 2024 |
| Total | 4 |
2 |
2 |
26 |
12 |
1 |
11 |
10 |
13 |
4 |
1 |
0 |
86 |
| Single |
4 |
2 |
2 |
26 |
12 |
1 |
11 |
10 |
13 |
4 |
1 |
0 |
86 |
| Multi |
0 |
0 |
0 |
0 |
0 |
0 |
0 |
0 |
0 |
0 |
0 |
0 |
0 |
Minot Single Family Permits - 2006 to Current
Number Of Permits - Time Frame One Year Candles
Minot Multi Family Permits - 2006 to Current
Number Of Permits - Time Frame One Year Candles

Mayor and City Manager. How much did the Taxpayers pay for that Selfie? At The White House
Living High Off The Taxpayer Hog - As They Make Minot Great Again - Sipma & His Song & Dance Partner The Million Dollar Manager Barry - MMGA
"My Son, My Son, Walk Along The Mouse River North Of Minot, Walk In The Trees And Drink In The Spirit Of These Primeval Forest Lands
For Soon The Greed Of Man May Destroy Them Forever" - "If The City Folk Have Their Way The Valley Will Die" - Orlin Hanson - Vanishing Minot - Dams Of Contention
"Municipal Finance Doesn't Engender Public Confidence" - Editor of local Minot Newspaper
No it should be - The Incompetent Management Of Municipal Finance Doesn't Engender Public Confidence!
What A Joke! - There Is No Excuse!
| Taco Johns & Joan's Hallmark at Dakota
Square - Pour House - Valhalla Bar & Grill Multiple Businesses Close Going Into 2019 |
| 2019 - 2020 - Minot BNSF
employees have stated some 25% of train crews have been
furloughed or laid off in Minot. Also two classes of new conductor trainees were never offered a job! As the seasonal slowdown of May & June just keeps going. BNSF Minot 2021 Layoffs As Trump rejects 2 person crew size - putting thousands of jobs in jeopardy! The Deal Maker |
| 2020 - BNSF Throws A
Monkey Wrench In To The Plan Of The Unplanned Flood
Control Project A $50 Million Dollar Monkey Wrench City Council Is Seething - Blaming BNSF |
| Minot
Isn't
Vanishing
Because of the
2011 Flood -
Minot is
Vanishing
Because of
Flood Control
& Taxes -
Vanishing
People,
Property,
& Money Minot Has The Highest Property Taxes In North Dakota |
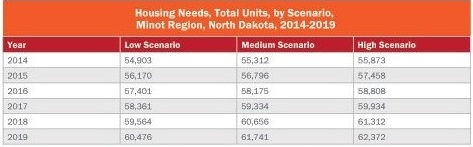
The 5 Year (Fantasy) Study - 10/2014
"The Minot region could see an employment potential of between 55,000 and 60,000.
Minot region could have a total population potential of around 123,500 at the end of 2014
& a total population potential of 137,000 in 2019.
The Minot region could see a 12 percent increase or by 6,430 units within the five-year time frame, according to the study."
Actual Units Built, 2014 - 719 units, 2015 - 252 units, 2016 - 47 units, 2017 - 82 units, - 2018 - 68 units, (- 317 demos) = 851 units.
(5,579) Units short of the fantasy study!
The Private Game?
"Triplett supported the Berger Group’s proposal, saying it had better modeling capabilities and questioned whether lawmakers were being
too provincial in choosing KLJ, which receives a majority of its business from the Bakken oil-producing region of western North Dakota."
The Taxpayers Paid $125,000.00 For a 215 Page Study With Some 50 Pages As Covers or Resources That Is A Whooping $581.00 A Page
Google Searches - Decline Rates - Capex, Debt, Hype & Some Charts and 1/3/5/10 Year Averages Would Have Given You A Better Guesstimate
It Is As It Was When It Was Released In 2014 - A Fantasy Study On The Taxpayers Tab
| KLJ Hired For Study | The Private Game | The Study |
| The Giant Debt Party - GDP 2020 Budget |
"Make It Stop" "Tear Down The Parking Ramps" |
| Make Minot Pretty! "Minot's Pretty Mess!" |
"How
Are We
Supposed To
Live?" "Think Hard!" |
| "At
A Loss" "For Word's" |
Minot Debt
& Real Estate Where is the 1 Billion and 133 Million Dollars? |
| "It's
Who" "You Know" |
"Minot
Has Changed" "For The Worse" |
| "Do
Not Buy Local" "They Don't" |
Drinking
- Minot Growth
Industry Back To Being A Drunk Hole |
| "Fear
- Time &
Money" "Open Your Mouth & Get Fired" |
Minot Flood Control Debt - Tax Increases - Public Equity Debt Projections
Minot Is Going To Have A Children's Museum For Some $7 Million - With Annual Cost Of $600 K
While Some 25% Of Minot Children Go Hungry - Go Figure!
The Needs Of The Few Well Always Out Weigh The Needs Of The Many - A Children's Soup Kitchen Is What's Needed
| The Children's Museum | Minot Children Go Hungry |
Feels like we're on the edge right now I wish that I could say I'm proud I'm sorry that I let you down Let you down
All
these voices in my head get loud I wish that I could shut them out
I'm sorry that I let you down
L-l-let you down
Let You DownThe Let Down - From Make Minot to The Same Old Good Old Boys Club - Shawn Sipma
His Hero the Outsider Over Paid ($175K a year) City Manager Who Doesn't Know His Ass From A Hole In The Ground
$3,365 a week, at 40 hours is $84.00 a hour, What exactly does this guy bring to the table that a spread sheet or a local couldn't do for $65k a year?
| The Discouraged Sneak | The Sneaky Mayor |
The Million Dollar Manager Gets 13.5 Weeks Of Paid Time Off A Year
Who Are These People? Some Wall Street Corporation The Way They Blow Taxpayer Money
Minot City Council Doubles It's Wages & The Minot Million Dollar City Manager
The Governor's Pay Of $113K A Year Doesn't Come Close To The Million Dollar City Manager
The Mayor & The Manager Are Buddies They Sing & Dance Together - All That Money They Can Afford To
If You Ever Need To Talk To The Million Dollar Manager - Just Beat Your Head Against A Wall & Talk To A Door Knob
Controversy - Scandal Would Be The Better Word
"If you’re a city employee, can you feel comfortable having a hard conversation with the mayor about his good friend, the city manager?
Or do you keep your mouth shut? The city employees I’ve spoken to are choosing the latter."
| Double Or Nothing Mind Boggling |
The Million Dollar Manager And The Pricey Trip |
The Sipma, Barry Saga Continues - Minot Is Being Run Like A "Gestapo"
Barry is interrogating employees at the Police Station just like the "Gestapo"
These people make Minot an Embarrassment to live in and do business in
Council To Investigate The Gestapo
Someone should tell Sipma & Barry If you don't like the heat, then you should not have signed up to work in the kitchen!
| Criticism & The Secret Police Make Minot Great Again |
The Era Of Trump - Paranoia This Is Minot Government |
Now We Get It - The City Council & Mayor That Answer To The Million Dollar City Manager
As He Runs The "Gestapo"
The Paranoid "Gestapo" Manager Is Quickly Fired - April 2020
"According to the report, Council President Mark Jantzer and Mayor Shaun Sipma were alerted to employee concerns last November"
Yet alone they still moved to give Barry a new 5 year contract that will cost taxpayers a $182.000 to get rid of Barry
Now Its Time To Fire Sipma & His Make Minot Great Again Crap That Got him Elected
| Good Buddy Gets Fired Make Minot Great Again |
The Report This Is Minot Government |
| Are You Serious |
It's Time To Change - Again |
Now We Get It - Good Old Boys - Page 21
The investigation revealed that some members of the Council and the Mayor had either actual or implied notice of issues involving the City Manager.
David Lakefield had spoken to Alderman Jantzer on either November 16 or 17, 2019, about issues with the City Manager, prior to the council vote
on his contract renewal. Lakefield reported to Jantzer that the City Manager was making it so stressful for some department heads that they considered
leaving or retiring early. He was afraid the city would be losing good employees because of the City Manager. Under the City’s complaint process,
Lakefield’s complaint should have been immediately reported to the HR Director for investigation. Although he had a duty to the employees of the city to
see that they had an environment safe from harassment and to comply with the City’s policies, Alderman Jantzer did not report this to the HR Director,
so it could be investigated. On October 22, 2019, the Mayor met with a member of the community to discuss city matters. During the meeting, it was
brought to his attention that some long-time city employees were having issues with the City Manager; they were not being treated well and some
considered leaving. Again, when the Mayor met with Rob Port on November 24, 2019, he was told that some city employees were dissatisfied working
with the City Manager. This was enough information to give the Mayor implied notice of issues between the City Manager and some city employees.
At a minimum, it required an inquiry of employees about their working relationships with the City Manager.
To ensure that no city policies were being violated, a report to the HR Director should have been made
| Dickinson Return To Top Of Page |
Link To City Of Dickinson Building Permits - Dickinson Building Permits - MOM
The powers that be have switched to a undefined Pie chart for permits, what a Joke, data will slowly come from US Census
| Dickinson On realtor.com |
Dickinson - Taxpayer City Equity Debt | Dickinson On loopnet.com |
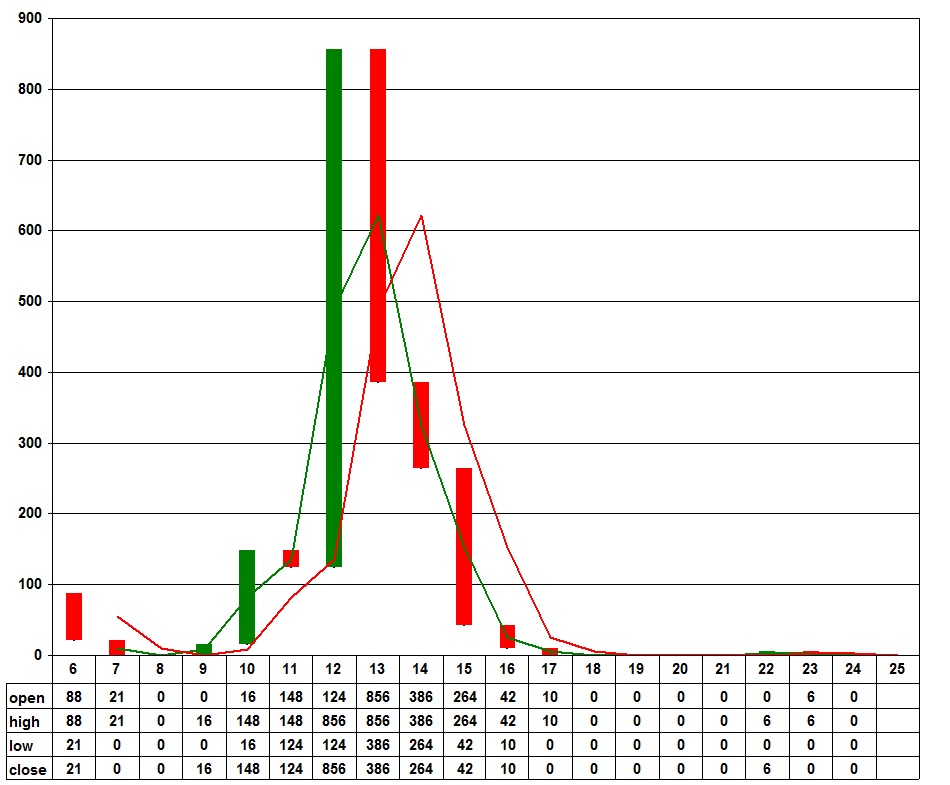
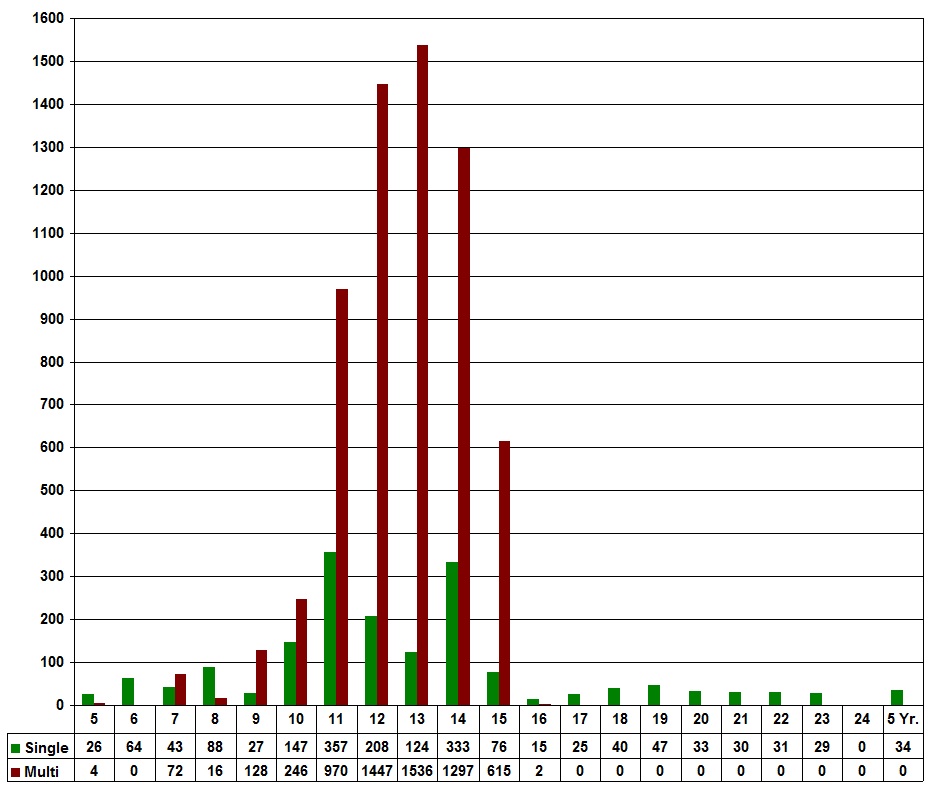
Dickinson - Single - Multi - Family Building Permits
Number Of Permits 2005 To Current
With Five Year Average 2021 - 2025
Dickinson Single Family Permit Numbers From 1980 To 2019 - New Highest Number Was 628 Permits In 2012
The Previous High Was 219 In 1981 - The Bust Of The Last Oil Boom Deja Vu - 1982
Dickinson Multi Family Permit Numbers From 1980 To 2019 - New Highest Number Was 856 Units In 2012
The Previous High Was 321 Units In 1980 - The Bust Of The Last Oil Boom Deja Vu - 1982
1980 to 2026 - 46 Year Total Annual Mean Average Is 144 Units
1983 Bust to 2005 Boom - 22 Year Total Annual Mean Average Is 163 Units
2005 Boom to 2015 Bust - 11 Year Total Annual Mean Average Is 361 Units
Dickinson Annual Numbers - 2020 - 2039
| 2020
- 2039 - Housing Unit Building Permits for:
DICKINSON, ND (Stark County) 2005
Clean Water Act Changed
|
|||||||||||||||||||||
|---|---|---|---|---|---|---|---|---|---|---|---|---|---|---|---|---|---|---|---|---|---|
| Year |
2020 | 2021 | 2022 | 2023 | 2024 | 2025 | 2026 | 2027 | 2028 | 2029 | 2030 | 2031 | 2032 |
2033 | 2034 | 2035 | 2036 | 2037 | 2038 | 2039 |
Total |
| Total | 27 |
49 |
38 |
38 |
18 |
54 |
21 |
245 |
|||||||||||||
| Single | 27 |
49 |
32 |
38 |
18 |
54 |
21 |
239 |
|||||||||||||
| Multi | 0 |
0 |
6 |
0 |
0 |
0 |
0 |
6 |
|||||||||||||
| 2000
- 2019 - Housing Unit Building Permits for:
DICKINSON, ND (Stark County) 2005
Clean Water Act Changed
|
|||||||||||||||||||||
|---|---|---|---|---|---|---|---|---|---|---|---|---|---|---|---|---|---|---|---|---|---|
| Year |
2000 | 2001 | 2002 | 2003 | 2004 | 2005 | 2006 | 2007 | 2008 | 2009 | 2010 | 2011 | 2012 | 2013 | 2014 | 2015 | 2016 | 2017 | 2018 | 2019 |
Total |
| Total | 33 | 53 | 53 | 75 | 76 | 143 | 98 | 91 | 100 | 104 | 308 | 307 | 1484 | 674 | 535 | 132 | 31 | 57 | 56 |
51 |
4461 |
| Single | 33 | 41 | 46 | 58 | 62 | 55 | 77 | 91 | 100 | 88 | 160 | 183 | 628 | 288 | 271 | 90 | 21 | 57 | 56 |
51 |
2456 |
| Multi | 0 | 12 | 7 | 17 | 14 | 88 | 21 | 0 | 0 | 16 | 148 | 124 | 856 | 386 | 264 | 42 | 10 | 0 |
0 |
0 |
2005 |
| 1980 - 1999 - Housing Unit Building Permits for: DICKINSON, ND (Stark County) | |||||||||||||||||||||
|---|---|---|---|---|---|---|---|---|---|---|---|---|---|---|---|---|---|---|---|---|---|
| Year |
1980 | 1981 | 1982 | 1983 | 1984 | 1985 | 1986 | 1987 | 1988 | 1989 | 1990 | 1991 | 1992 | 1993 | 1994 | 1995 | 1996 | 1997 | 1998 | 1999 |
Total |
| Total | 530 | 514 | 335 | 92 | 57 | 24 | 14 | 12 | 16 | 4 | 2 | 7 | 12 | 14 | 17 | 62 | 38 | 85 | 74 | 34 |
1943 |
| Single | 209 | 219 | 193 | 86 | 48 | 24 | 8 | 12 | 8 | 4 | 2 | 7 | 12 | 14 | 17 | 16 | 38 | 48 | 42 | 34 |
1041 |
| Multi | 321 | 295 | 142 | 6 | 9 | 0 | 6 | 0 | 8 | 0 | 0 | 0 | 0 | 0 | 0 | 46 | 0 | 37 | 32 | 0 |
902 |
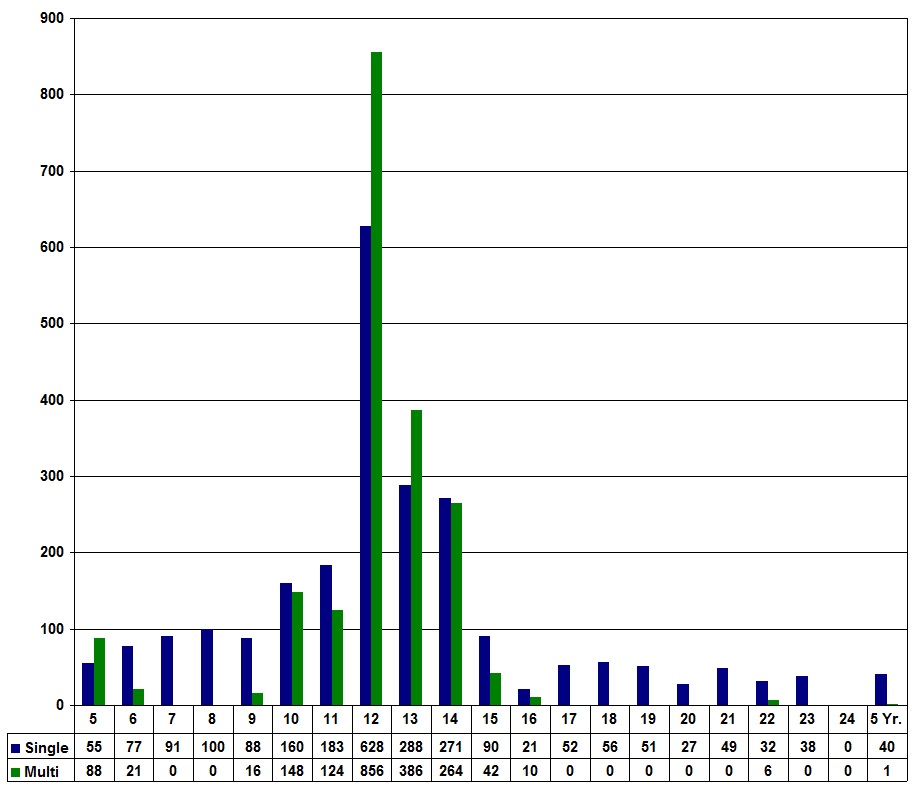
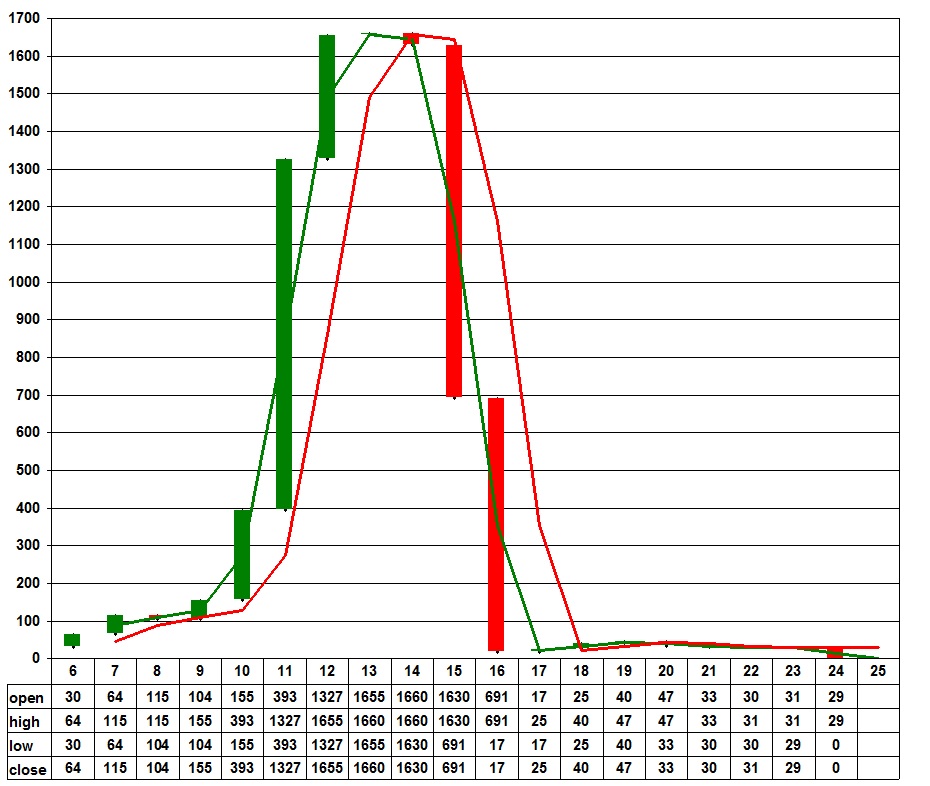
Dickinson Single Multi Family Permits Combined - 2006 to Current
With "New Bold Leadership In The White House And In Bismarck" The Numbers Can Only Get Better
The Phrase Was Coined By Former North Dakota GOP Governor Doug Burgum - The Only Candidate For Governor To Endorse Trump
The Current Permit Count Of 2026 Goes Back To The Low Of 2024
Number Of Permits - Time Frame One Year Candles
YOY 2013-2014 Single Down 52% - YOY 2014-2015 Single Down 6% - YOY 2015-2016 Single Down 67% - YOY 2016-2017 Single Down 76%
YOY 2017-2018 Single Up 63% - YOY 2018-2019 Single Up 2% - YOY 2019-2020 Single Down 8% - YOY 2020-2021 Single Down 53%
YOY 2021-2022 Single Up 47% - YOY 2022-2023 Single Down 35% - YOY 2023-2024 Single Up 16% - YOY 2024-2025 Single Down 52%
YOY 2025-2026 Single Up 66%
YOY 2026 - 2027 - 5 Months Single Family Permits Down 33 Units
YOY 2013 - 2014 Multi Down 55% - YOY 2014-2015 Multi Down 33% - YOY 2015-2016 Multi Down 84% - YOY 2016-2017 Multi Down 76%
YOY 2017-2018 Multi Down 90% - YOY 2018-2019 Multi Down 0% - YOY 2019-2020 Multi Down 0% - YOY 2020-2021 Multi Down 0%
YOY 2021-2022 Multi Down 0% - YOY 2022-2023 Multi Up 6% - YOY 2023-2024 Multi Down 0% - YOY 2024-2025 Multi Down 0%
YOY 2025-2026 Multi Down 0%
YOY 2026 - 2027 - 5 Months Multi Family Permits Down 0 Units
See Cumulative Charts At Top Of Page For YOY Percentage Of Bakken Building Permits - The Numbers & Charts Pretty Much Tell The Story
The powers that be have switched to a undefined Pie chart for permits, what a Joke, data will slowly come from US Census
Dickinson 2026
| Housing Unit Building Permits for: DICKINSON, ND (Stark County) 2005 Clean Water Act Changed | |||||||||||||
|---|---|---|---|---|---|---|---|---|---|---|---|---|---|
| Month Year |
Jan. 2026 |
Feb. 2026 |
Mar. 2026 |
Apr. 2026 |
May 2026 |
June 2026 |
July 2026 |
Aug. 2026 |
Sep. 2026 |
Oct. 2026 |
Nov. 2026 |
Dec. 2026 |
Total 2026 |
| Total | 21 |
||||||||||||
| Single |
21 |
||||||||||||
| Multi |
0 |
||||||||||||
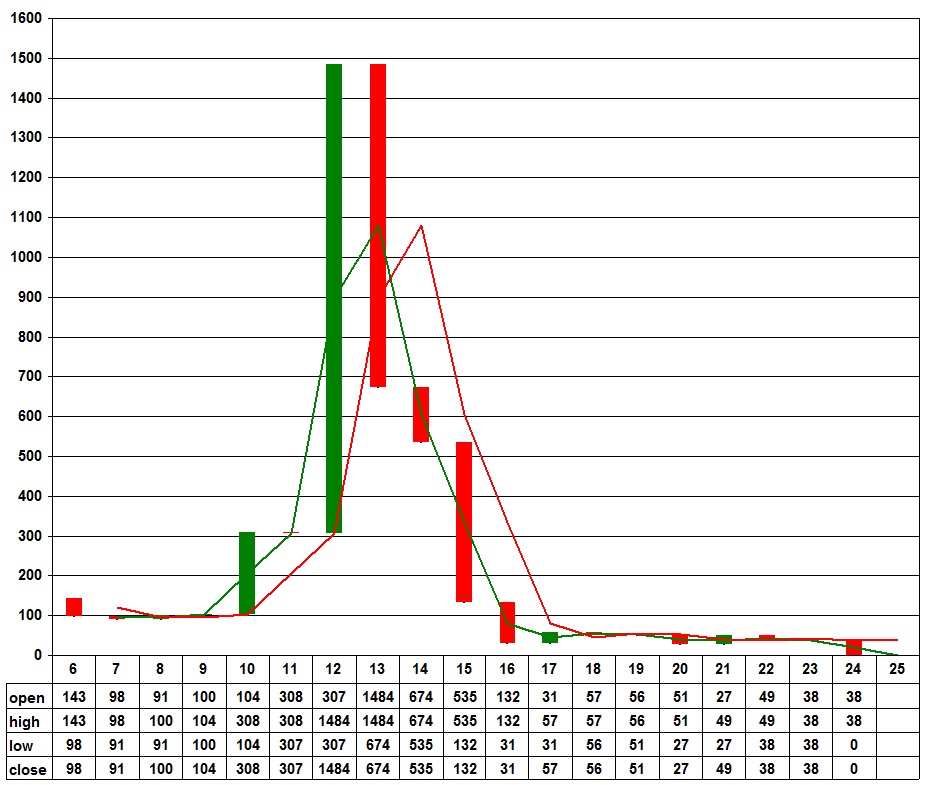
Dickinson Single Family Permits - 2006 to Current
Number Of Permits - Time Frame One
Year Candles
Dickinson Multi Family Permits - 2006 to Current

Number Of Permits - Time Frame One Year Candles
Is it possible?
The Dickinson Mafia
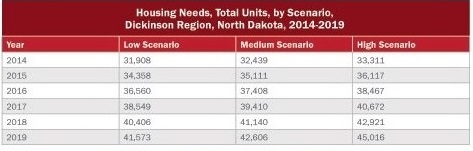
The 5 Year (Fantasy) Study - 2014
"The Dickinson region could see a potential growth in employment to of 40,000 and 45,000.
The study also found the Dickinson region to have an estimated population potential around 60,000 at the end of 2014
and a population potential in 2019 of around 77,000. Housing growth in the Dickinson region could increase
by roughly 28 percent from 2014 to 2019, which translates into an increase in housing needs of about 9,500 units."
Actual Units Built, 2014 - 535 units, 2015 - 132 units, 2016 - 31 units, 2017 - 57 units, 2018 - 56 units = 811 units.
(8,689) Units short of the fantasy study!
The Private Game?
"Triplett supported the Berger Group’s proposal, saying it had better modeling capabilities and questioned whether lawmakers were being
too provincial in choosing KLJ, which receives a majority of its business from the Bakken oil-producing region of western North Dakota."
The Taxpayers Paid $125,000.00 For a 215 Page Study With Some 50 Pages As Covers or Resources That Is A Whooping $581.00 A Page
Google Searches - Decline Rates - Capex, Debt, Hype & Some Charts and 1/3/5/10 Year Averages Would Have Given You A Better Guesstimate
It Is As It Was When It Was Released In 2014 - A Fantasy Study On The Taxpayers Tab
Dickinson Multi Family Permits - 2006 to Current
Number Of Permits - Time Frame One Year Candles
Is it possible?
The Dickinson Mafia
The 5 Year (Fantasy) Study - 2014
"The Dickinson region could see a potential growth in employment to of 40,000 and 45,000.
The study also found the Dickinson region to have an estimated population potential around 60,000 at the end of 2014
and a population potential in 2019 of around 77,000. Housing growth in the Dickinson region could increase
by roughly 28 percent from 2014 to 2019, which translates into an increase in housing needs of about 9,500 units."
Actual Units Built, 2014 - 535 units, 2015 - 132 units, 2016 - 31 units, 2017 - 57 units, 2018 - 56 units = 811 units.
(8,689) Units short of the fantasy study!
The Private Game?
"Triplett supported the Berger Group’s proposal, saying it had better modeling capabilities and questioned whether lawmakers were being
too provincial in choosing KLJ, which receives a majority of its business from the Bakken oil-producing region of western North Dakota."
The Taxpayers Paid $125,000.00 For a 215 Page Study With Some 50 Pages As Covers or Resources That Is A Whooping $581.00 A Page
Google Searches - Decline Rates - Capex, Debt, Hype & Some Charts and 1/3/5/10 Year Averages Would Have Given You A Better Guesstimate
It Is As It Was When It Was Released In 2014 - A Fantasy Study On The Taxpayers Tab
| KLJ Hired For Study | The Private Game | The Study |
| Williston Return To Top Of Page |
Link To City Of Williston Building Permits - Williston Building Permits - MOM
| Williston On realtor.com | Williston - Taxpayer City Equity Debt | Williston On loopnet.com |
| Williston
$1 Billion Dollar North Star Center Over 2000 Residential Units 2.5 Million Sq. Feet Of Commercial Bankruptcy - 2018 - $50 Million In Indicated Liabilities |
Williston
$300 Million Dollar New Airport No Secured Funds To Pay For It But It's Being Built With Taxpayer Equity Debt |
Williston
$500 Million Dollar The Williston Crossing Williston To Grow To 159,000 People By 2024 "Tom Rolfstad" Shelved In 2017 - Never Started |
Williston - Single - Multi - Family Building Permits
Number Of Permits 2005 To Current
With Five Year Average 2021 - 2025
Williston Single Family Permit Numbers From 1980 To 2019 - New Highest Number Was 357 Permits In 2011
The Previous High Was 241 In 1980 - The Bust Of The Last Oil Boom Deja Vu - 1982
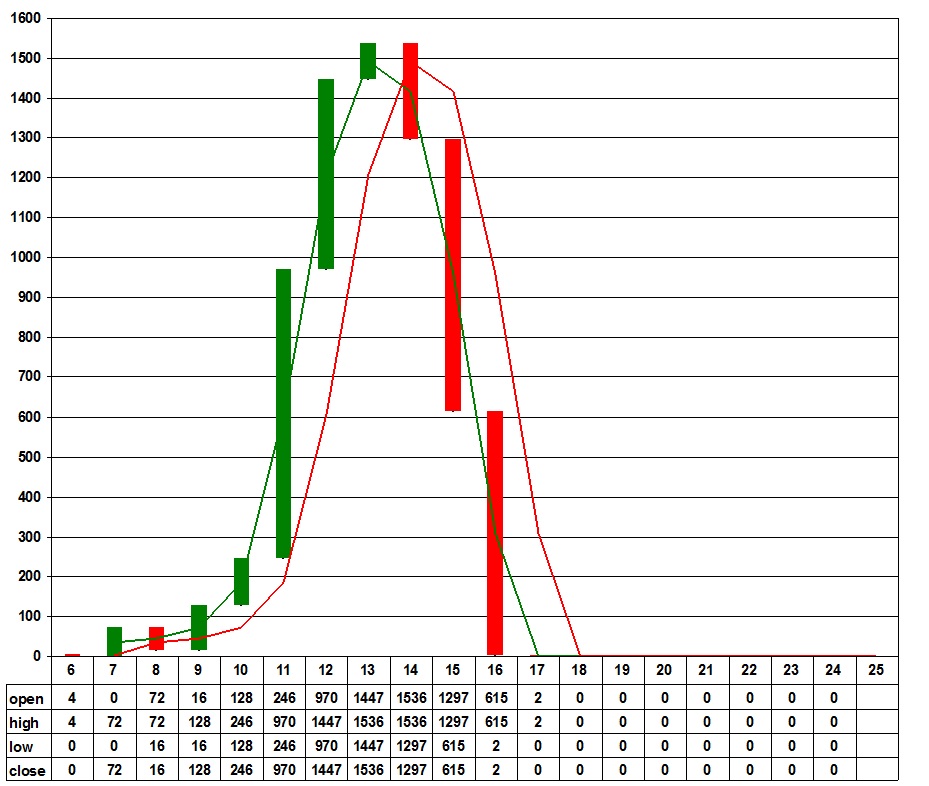
Williston Multi Family Permit Numbers From 1980 To 2019 - New Highest Number Was 970 Units In 2011
The Previous High Was 361 Units In 1981 - The Bust Of The Last Oil Boom Deja Vu - 1982
1980 to 2026 - 46 Year Total Annual Mean Average Is 210 Units
1983 Bust to 2005 Boom - 22 Year Total Annual Mean Average Is 11 Units
2005 Boom to 2015 Bust - 11 Year Total Annual Mean Average Is 711 Units
Williston Annual Numbers - 2020 - 2039
| 2020
- 2039 - Housing Unit Building Permits for:
WILLISTON, ND (Williams County) 2005
Clean Water Act Changed
|
|||||||||||||||||||||
|---|---|---|---|---|---|---|---|---|---|---|---|---|---|---|---|---|---|---|---|---|---|
| Year |
2020 | 2021 | 2022 | 2023 | 2024 | 2025 | 2026 | 2027 | 2028 | 2029 | 2030 | 2031 | 2032 | 2033 | 2034 | 2035 | 2036 | 2037 | 2038 | 2039 |
Total |
| Total | 33 |
30 |
31 |
29 |
50 |
71 |
2 |
246 |
|||||||||||||
| Single | 33 |
30 |
31 |
29 |
50 |
71 |
2 |
246 |
|||||||||||||
| Multi | 0 |
0 |
0 |
0 |
0 |
0 |
0 |
0 |
|||||||||||||
| 2000
- 2019 - Housing Unit Building Permits for:
WILLISTON, ND (Williams County) 2005
Clean Water Act Changed
|
|||||||||||||||||||||
|---|---|---|---|---|---|---|---|---|---|---|---|---|---|---|---|---|---|---|---|---|---|
| Year |
2000 | 2001 | 2002 | 2003 | 2004 | 2005 | 2006 | 2007 | 2008 | 2009 | 2010 | 2011 | 2012 | 2013 | 2014 | 2015 | 2016 | 2017 | 2018 | 2019 |
Total |
| Total | 17 | 14 | 13 | 20 | 18 | 30 | 64 | 115 | 104 | 155 | 393 | 1327 | 1655 | 1660 | 1630 | 691 | 17 |
25 | 40 |
47 |
8035 |
| Single | 17 | 14 | 13 | 20 | 18 | 26 | 64 | 43 | 88 | 27 | 147 | 357 | 208 | 124 | 333 | 76 | 15 | 25 | 40 |
47 |
1702 |
| Multi | 0 | 0 | 0 | 0 | 0 | 4 | 0 | 72 | 16 | 128 | 246 | 970 | 1447 | 1536 | 1297 | 615 | 2 | 0 |
0 |
0 |
6333 |
| 1980 - 1999 - Housing Unit Building Permits for: WILLISTON, ND (Williams County) | |||||||||||||||||||||
|---|---|---|---|---|---|---|---|---|---|---|---|---|---|---|---|---|---|---|---|---|---|
| Year |
1980 | 1981 | 1982 | 1983 | 1984 | 1985 | 1986 | 1987 | 1988 | 1989 | 1990 | 1991 | 1992 | 1993 | 1994 | 1995 | 1996 | 1997 | 1998 | 1999 |
Total |
| Total | 491 | 512 | 218 | 33 | 10 | 14 | 2 | 4 | 3 | 1 | 6 | 1 | 0 | 9 | 14 | 26 | 22 | 8 | 15 | 2 |
1391 |
| Single | 241 | 151 | 112 | 33 | 10 | 14 | 2 | 4 | 3 | 1 | 6 | 1 | 0 | 9 | 14 | 26 | 16 | 8 | 15 | 2 |
668 |
| Multi | 250 | 361 | 106 | 0 | 0 | 0 | 0 | 0 | 0 | 0 | 0 | 0 | 0 | 0 | 0 | 0 | 6 | 0 | 0 | 0 |
723 |
Williston Single Multi Family Permits Combined - 2006 to Current
With "New Bold Leadership In The White House And In Bismarck" The Numbers Can Only Get Better
The Phrase Was Coined By Former North Dakota GOP Governor Doug Burgum - The Only Candidate For Governor To Endorse Trump
The Current Permit Count Of 2026 Goes Back To The Low Of 1999
Number Of Permits - Time Frame One Year Candles
YOY 2013-2014 Single Down 40% - YOY 2014-2015 Single Up 63% - YOY 2015-2016 Single Down 78% - YOY 2016-2017 Single Down 79%
YOY 2017-2018 Single Up 38% - YOY 2018-2019 Single Up 38% - YOY 2019-2020 Single Up 15% - YOY 2020-2021 Single Down 31%YOY
2021-2022 Single Down 10% - YOY 2022-2023 Single Up1% - YOY 2023-2024 Single Down2% - YOY 2024-2025 Single Up 43%
YOY 2025-2026 Single Up 30%
YOY 2026 - 2027 - 5 Months Single Family Permits Down 69 Units
YOY 2013-2014 Multi Up 6% - YOY 2014-2015 Multi Down 15% - YOY 2015-2016 Multi Down 47% - YOY 2016-2017 Multi Down 99%
YOY 2017-2018 Multi Down 2% - YOY 2018-2019 Multi Down 0% - YOY 2019-2020 Multi Down 0% - YOY 2020-2021 Multi Down 0%
YOY 2021-2022 Multi Down 0% - YOY 2022-2023 Multi Down 0% - YOY 2023-2024 Multi Down 0% - YOY 2024-2025 Multi Down 0%
YOY 2025-2026 Multi Down 0%
YOY 2025 - 2027 - 5 Months Multi Family Permits Down 0 Units
See Cumulative Charts At Top Of Page For YOY Percentage Of Bakken Building Permits - The Numbers & Charts Pretty Much Tell The Story
Williston is posting the same months over and over, data will slowly come from US Census
Williston 2026
| Housing Unit Building Permits for: WILLISTON, ND (Williams County) 2005 Clean Water Act Changed | |||||||||||||
|---|---|---|---|---|---|---|---|---|---|---|---|---|---|
| Month Year |
Jan. 2026 |
Feb. 2026 |
Mar. 2026 |
Apr. 2026 |
May 2026 |
June 2026 |
July 2026 |
Aug. 2026 |
Sep. 2026 |
Oct. 2026 |
Nov. 2026 |
Dec. 2026 |
Total 2026 |
| Total | 0 |
2 |
0 |
0 |
0 |
2 |
|||||||
| Single |
0 |
2 |
0 |
0 |
0 |
2 |
|||||||
| Multi |
0 |
0 |
0 |
0 |
0 |
0 | |||||||
Williston Single Family Permits - 2006 to Current
Number Of Permits - Time Frame One Year Candles
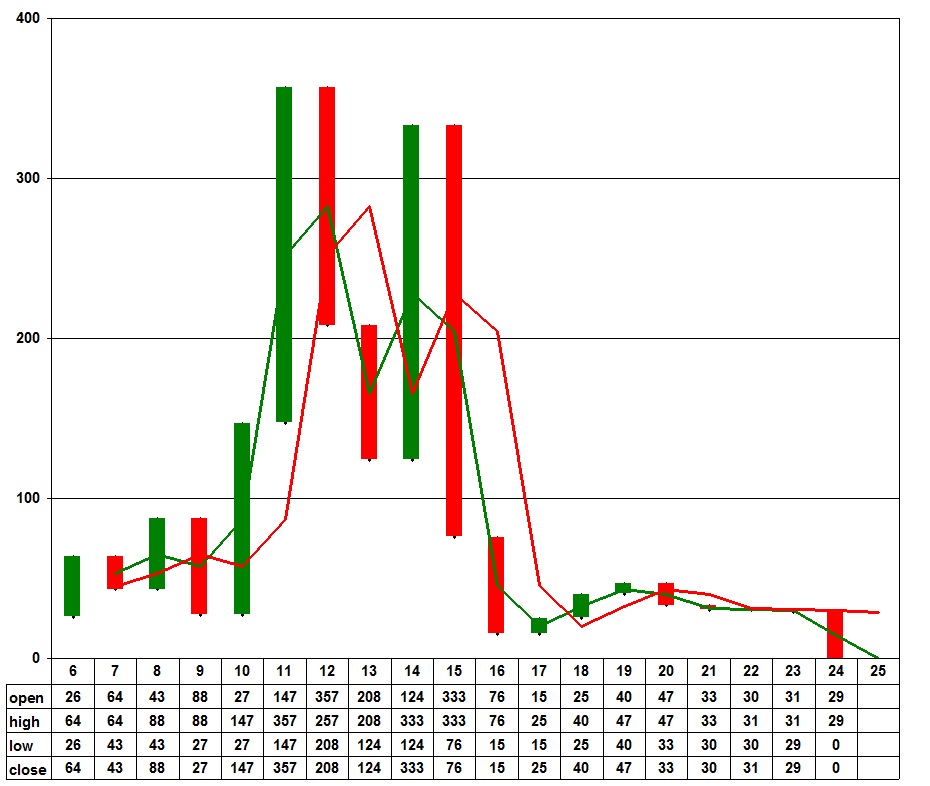
Williston Multi Family Permits - 2006 to Current
Cross - Recross & Down We Go - Vroooooooooooooooom
Number Of Permits - Time Frame One Year Candles
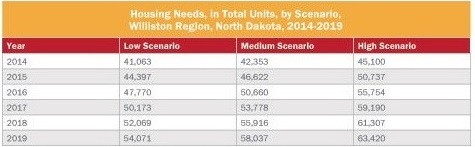
The 5 Year (Fantasy) Study - 2014
"The Williston region could see a 2019 employment forecast of 65,000 and 70,000.
The Williston region could have a total population potential around 97,000 at the end of 2014.
The Williston region has potential to see a housing needs increase of more than 15,000 units from 2014 to 2019."
Actual Units Built, 2014 - 1630 units, 2015 - 291 units, 2016 - 17 units, 2017 - 25 units, 2018 - 40 units = 2003 units.
(12,997) Units short of the fantasy study!
The Private Game?
"Triplett supported the Berger Group’s proposal, saying it had better modeling capabilities and questioned whether lawmakers were being
too provincial in choosing KLJ, which receives a majority of its business from the Bakken oil-producing region of western North Dakota."
The Taxpayers Paid $125,000.00 For a 215 Page Study With Some 50 Pages As Covers or Resources That Is A Whooping $581.00 A Page
Google Searches - Decline Rates - Capex, Debt, Hype & Some Charts and 1/3/5/10 Year Averages Would Have Given You A Better Guesstimate
It Is As It Was When It Was Released In 2014 - A Fantasy Study On The Taxpayers Tab
| KLJ Hired For Study | The Private Game | The Study |
So I
say I say welcome, welcome to the boom town Pick
a habit We got plenty to go around Welcome,
welcome to the boom town
All that money makes such a succulent sound Welcome to the boom town
Welcome To The Boom
TownAll that money makes such a succulent sound Welcome to the boom town
| Bismarck Return To Top Of Page |
Link To City Of Bismarck Building Permits - Bismarck Building Permits - MOM
| Bismarck On realtor.com | Bismarck - Taxpayer City Equity
Debt |
Bismarck On loopnet.com |
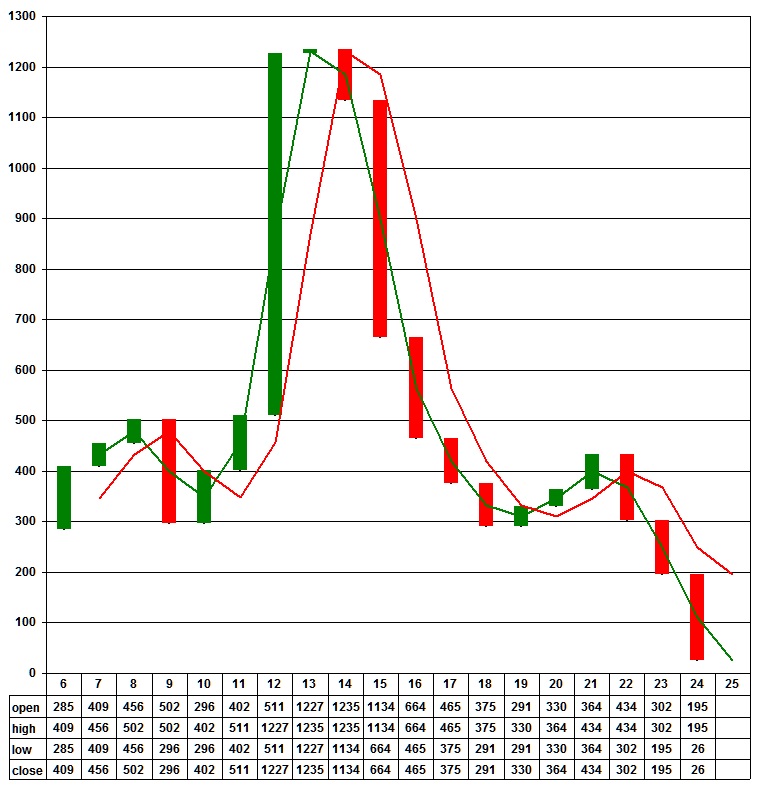
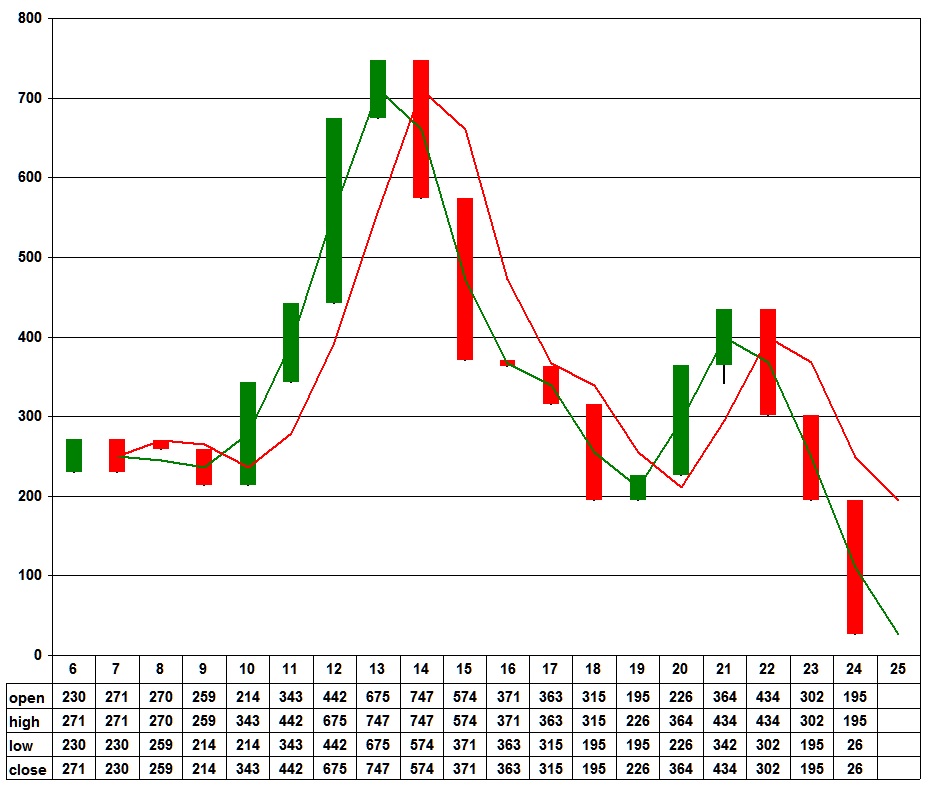
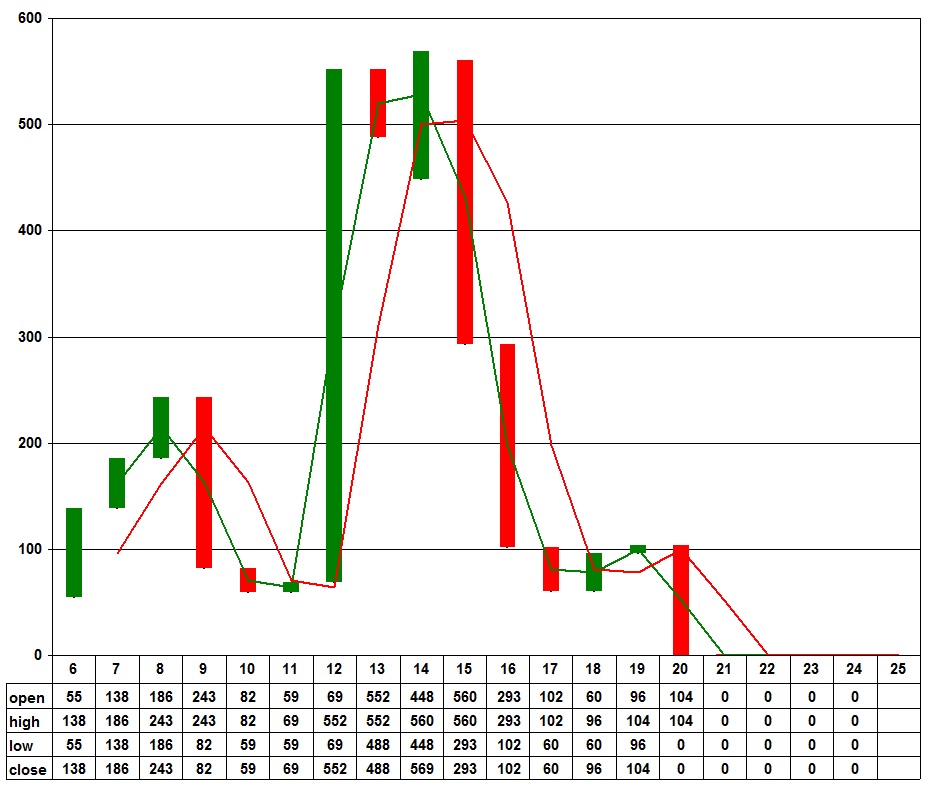
Bismarck - Single - Multi - Family Building Permits
Number Of Permits 2005 To Current
With Five Year Average 2021 - 2025
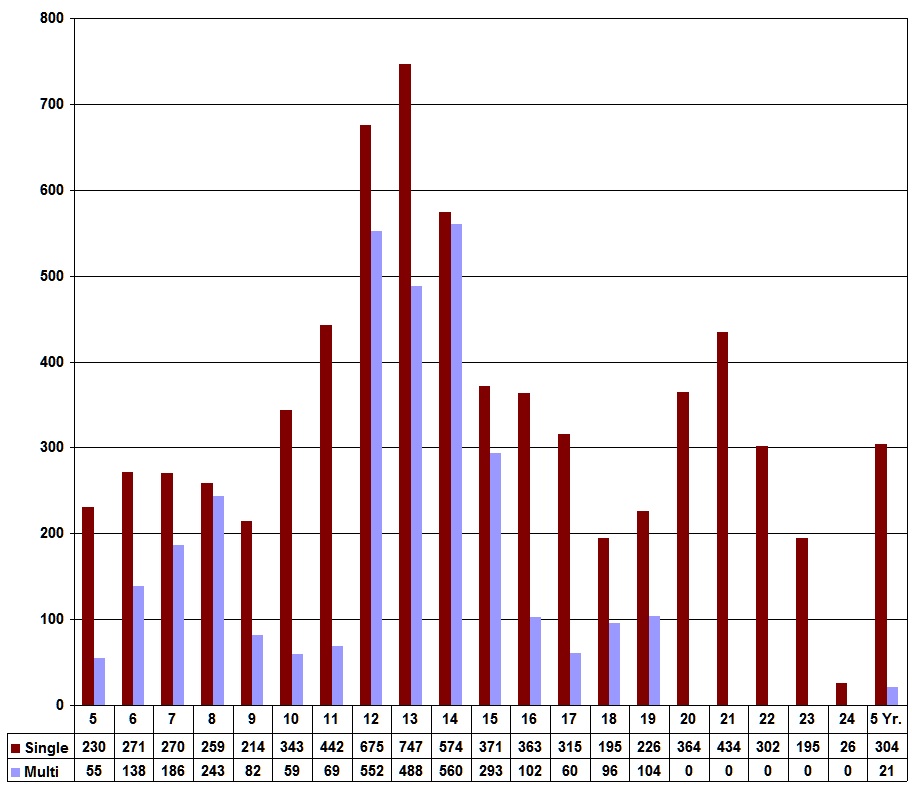
1980 to 2026 - 46 Year Total Annual Mean Average Is 417 Units
1983 Bust to 2005 Boom - 22 Year Total Annual Mean Average Is 360 Units
2005 Boom to 2015 Bust - 11 Year Total Annual Mean Average Is 547 Units
Bismarck Annual Numbers - 2020 -2039
| 2020 - 2039 - Housing Unit Building Permits for: BISMARCK, ND (Burleigh County) Burleigh County Is Not Oil Producing | |||||||||||||||||||||
|---|---|---|---|---|---|---|---|---|---|---|---|---|---|---|---|---|---|---|---|---|---|
| Year |
2020 |
2021 |
2022 |
2023 |
2024 | 2025 | 2026 | 2027 | 2028 | 2029 | 2030 | 2031 | 2032 | 2033 |
2034 |
2035 |
2036 |
2037 |
2038 |
2039 |
Total |
| Total | 364 |
434 |
302 |
195 |
419 |
307 |
108 |
2129 |
|||||||||||||
| Single |
364 |
434 |
302 |
195 |
243 |
267 |
108 |
1913 |
|||||||||||||
| Multi |
0 |
0 |
0 |
0 |
176 |
40 |
0 |
216 |
|||||||||||||
| 2000 - 2019 - Housing Unit Building Permits for: BISMARCK, ND (Burleigh County) Burleigh County Is Not Oil Producing | |||||||||||||||||||||
|---|---|---|---|---|---|---|---|---|---|---|---|---|---|---|---|---|---|---|---|---|---|
| Year |
2000 |
2001 |
2002 |
2003 |
2004 | 2005 | 2006 | 2007 | 2008 | 2009 | 2010 | 2011 | 2012 | 2013 |
2014 |
2015 |
2016 |
2017 |
2018 |
2019 |
Total |
| Total | 231 |
448 |
385 |
478 |
408 | 285 | 409 | 456 | 502 | 296 | 402 | 511 |
1227 | 1235 |
1134 |
664 |
465 |
375 |
291 |
330 |
10532 |
| Single |
123 |
179 |
212 |
263 |
282 | 230 | 271 | 270 | 259 | 214 | 343 | 442 |
675 | 747 |
574 |
371 |
363 |
315 |
195 |
226 |
6554 |
| Multi |
108 |
269 |
173 |
215 |
126 | 55 | 138 | 186 | 243 | 82 | 59 | 69 |
552 | 488 |
560 |
293 | 102 |
60 |
96 |
104 |
3978 |
| 1980 - 1999 - Housing Unit Building Permits for: BISMARCK, ND (Burleigh County) Burleigh County Is Not Oil Producing | |||||||||||||||||||||
|---|---|---|---|---|---|---|---|---|---|---|---|---|---|---|---|---|---|---|---|---|---|
| Year |
1980 | 1981 | 1982 | 1983 | 1984 | 1985 | 1986 | 1987 | 1988 | 1989 | 1990 | 1991 | 1992 | 1993 | 1994 | 1995 | 1996 | 1997 | 1998 | 1999 |
Total |
| Total | 392 | 125 | 161 | 872 | 376 | 139 | 144 | 192 | 162 | 312 | 299 | 360 | 402 | 411 | 596 | 305 | 250 | 452 | 428 | 261 |
6639 |
| Single | 144 | 60 | 93 | 291 | 169 | 92 | 87 | 138 | 130 | 163 | 180 | 197 | 239 | 252 | 238 | 132 | 164 | 136 | 163 | 140 |
3208 |
| Multi | 248 | 65 | 68 | 581 | 207 | 47 | 57 | 54 | 32 | 149 | 119 | 163 | 163 | 159 | 358 | 173 | 86 | 316 | 265 | 121 |
3431 |
Bismarck Single Multi Family Permits Combined - 2006 to Current
With "New Bold Leadership In The White House And In Bismarck" The Numbers Can Only Get Better
The Phrase Was Coined By Former North Dakota GOP Governor Doug Burgum - The Only Candidate For Governor To Endorse Trump
The Current Combined Permit Count Of 2026 Goes Back To The Low Of 1981
Time Frame One Year Candles
YOY 2013-2014 Single Up 10% - YOY 2014-2015 Single Down 24% - YOY 2015-2016 Single Down 35% - YOY 2016-2017 Single Down 2%
YOY - 2017-2018 Single Down 13% - YOY 2018-2019 Single Down 38% - YOY 2019-2020 Single Up 12% - YOY 2020-2021 Single Up 9%
YOY 2021-2022 Single Up 16% - YOY 2022-2023 Single Down 30% - YOY 2023-2024 Single Down 36% - YOY 2024-2025 Single Up 21%
YOY 2025-2026 Single Up 9%
YOY 2026 - 2027 - 5 Months Single Family Permits Down 11 Units
YOY 2013-2014 Multi Down 12% - YOY 2014-2015 Multi Up 13% - YOY 2015-2016 Multi Down 48% - YOY 2016-2017 Multi Down 65%
YOY 2017-2018 Multi Down 40% - YOY 2018-2019 Multi Up 38% - YOY 2019-2020 Multi Up 8% - YOY 2020-2021 Multi Down 0%
- YOY 2021-2022 Multi Down 0% - YOY 2022-2023 Multi Down 0% - YOY 2023-2024 Multi Down 0% - YOY 2024-2025 Multi Up 100%
YOY 2025-2026 Multi Down 77%
YOY 2026 - 2027 - 5 Months Multi Family Permits Down 0 Units
See Cumulative Charts At Top Of Page For YOY Percentage Of Bakken Building Permits - The Numbers & Charts Pretty Much Tell The Story
Bismarck 2026
| Housing Unit Building Permits for: BISMARCK, ND (Burleigh County) Burleigh County Is Not Oil Producing | |||||||||||||
|---|---|---|---|---|---|---|---|---|---|---|---|---|---|
| Month Year |
Jan. 2026 |
Feb. 2026 |
Mar. 2026 |
Apr. 2026 |
May 2026 |
June 2026 |
July 2026 |
Aug. 2026 |
Sep. 2026 |
Oct. 2026 |
Nov. 2026 |
Dec. 2026 |
Total 2025 |
| Total | 1 | 0 |
40 |
33 |
35 |
108 | |||||||
| Single |
1 |
0 |
40 |
33 |
35 |
108 | |||||||
| Multi |
0 |
0 |
0 |
0 |
0 |
0 | |||||||
| Housing Unit Building Permits for: BISMARCK, ND (Burleigh County) Burleigh County Is Not Oil Producing | |||||||||||||
|---|---|---|---|---|---|---|---|---|---|---|---|---|---|
| Month Year |
Jan. 2025 |
Feb. 2025 |
Mar. 2025 |
Apr. 2025 |
May 2025 |
June 2025 |
July 2025 |
Aug. 2025 |
Sep. 2025 |
Oct. 2025 |
Nov. 2025 |
Dec. 2025 |
Total 2025 |
| Total | 14 |
7 |
13 |
22 |
41 |
11 |
84 |
46 |
29 |
22 |
16 |
305 |
|
| Single |
14 |
7 |
13 |
22 |
41 |
11 |
44 |
46 |
29 |
22 |
16 |
265 |
|
| Multi |
0 |
0 |
0 |
0 |
0 |
0 |
40 |
0 |
0 |
0 |
0 |
40 | |
| Housing Unit Building Permits for: BISMARCK, ND (Burleigh County) Burleigh County Is Not Oil Producing | |||||||||||||
|---|---|---|---|---|---|---|---|---|---|---|---|---|---|
| Month Year |
Jan. 2024 |
Feb. 2024 |
Mar. 2024 |
Apr. 2024 |
May 2024 |
June 2024 |
July 2024 |
Aug. 2024 |
Sep. 2024 |
Oct. 2024 |
Nov. 2024 |
Dec. 2024 |
Total 2024 |
| Total | 7 |
19 |
0 |
19 |
25 |
22 |
202 |
37 |
39 |
22 |
12 |
2 |
419 |
| Single |
7 |
19 |
0 |
19 |
25 |
22 |
26 |
37 |
39 |
22 |
12 |
2 |
243 |
| Multi |
0 |
0 |
0 |
0 |
0 |
0 |
176 |
0 |
0 |
0 |
0 |
0 |
176 |
Bismarck Single Family Permits - 2006 to Current
Number Of Permits - Time Frame One Year Candles
Bismarck Multi Family Permits - 2006 to Current
Number Of Permits - Time Frame One Year Candles
| Fargo - The Go To Place For Low
Income Return To Top Of Page |
Link To City Of Fargo Building Permits - Fargo Building Permits - MOM
| Fargo On realtor.com | Fargo
- Taxpayer City Equity Debt |
Fargo On loopnet.com |
If You Really Look At Fargo & Spend Some Time Downtown You Begin To See A City Of Low Income
A Very Nice City Of Low Income - These Beautiful Buildings Full Of Low Income Residents
|
The Go To Place For Poor & Low Income |
If Your Poor & Low Income Move To Fargo |
|
Demographics Of Low Income In Fargo |
Ratio Of Single Family To Apartments |
| Number Of Low Income In Fargo |
Low Income Housing In Fargo |
|
Low Income Housing In Fargo - Images |
Downtown Fargo - Images |
|
Downtown Fargo Low Income Housing - Images |
Downtown Fargo Low Income Housing |
|
downtownfargo.com Lovely Downtown - Real Capital Investment |
Over
400 Hundred Restaurants & Eateries Seems To Be The Economic Engine For Low Income In Fargo |
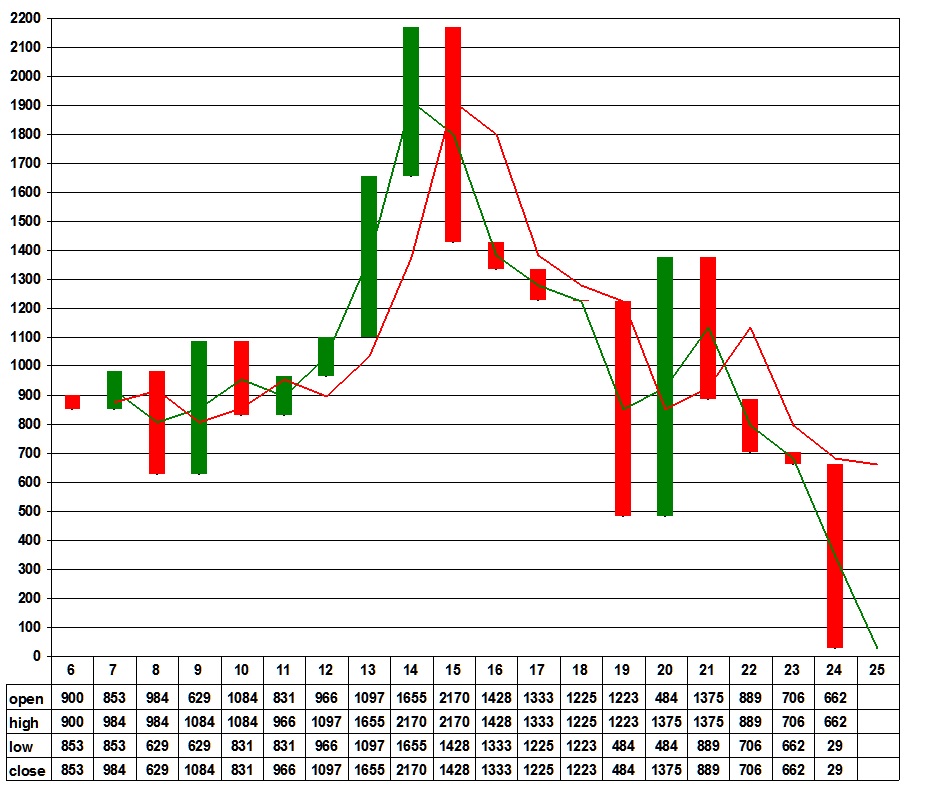
1980 to 2026 - 46 Year Total Annual Mean Average Is 953 Units
1983 Bust to 2005 Boom - 22 Year Total Annual Mean Average Is 997 Units
2005 Boom to 2015 Bust - 11 Year Total Annual Mean Average Is 1145 Units
Even Fargo Is Feeling The Bust - Annual Numbers - 2020 - 2039
| 2020 - 2039 - Housing Unit Building Permits for: FARGO, ND (Cass County) Cass County Is Not Oil Producing | |||||||||||||||||||||
|---|---|---|---|---|---|---|---|---|---|---|---|---|---|---|---|---|---|---|---|---|---|
| Year |
2020 |
2021 |
2022 |
2023 |
2024 | 2025 | 2026 | 2027 | 2028 | 2029 | 2030 | 2031 | 2032 | 2033 |
2034 |
2035 |
2036 |
2037 |
2038 |
2039 |
Total |
| Total | 1375 |
889 |
706 |
662 |
261 |
389 |
208 |
4490 |
|||||||||||||
| Single |
445 |
421 |
376 |
284 |
240 |
301 |
73 |
2140 |
|||||||||||||
| Multi |
930 |
468 |
330 |
378 |
21 |
88 |
135 |
2350 |
|||||||||||||
| 2000 - 2019 - Housing Unit Building Permits for: FARGO, ND (Cass County) Cass County Is Not Oil Producing | |||||||||||||||||||||
|---|---|---|---|---|---|---|---|---|---|---|---|---|---|---|---|---|---|---|---|---|---|
| Year |
2000 |
2001 |
2002 |
2003 |
2004 | 2005 | 2006 | 2007 | 2008 | 2009 | 2010 | 2011 | 2012 | 2013 |
2014 |
2015 |
2016 |
2017 |
2018 |
2019 |
Total |
| Total | 854 |
932 |
1220 |
981 |
975 | 900 | 853 | 984 | 629 | 1084 | 831 | 966 | 1097 | 1655 |
2170 |
1428 |
1333 |
1225 |
1223 |
484 |
21824 |
| Single |
304 |
327 |
401 |
455 |
441 | 491 | 470 | 447 | 404 | 353 | 334 | 283 | 403 | 509 |
377 |
526 |
474 |
444 |
309 |
312 |
8064 |
| Multi |
550 |
605 |
819 |
526 |
534 | 409 | 383 | 537 | 225 | 731 | 497 | 683 | 694 | 1146 |
1793 |
902 |
859 |
781 |
914 |
172 |
13760 |
| 1980 - 1999 - Housing Unit Building Permits for: FARGO, ND (Cass County) Cass County Is Not Oil Producing | |||||||||||||||||||||
|---|---|---|---|---|---|---|---|---|---|---|---|---|---|---|---|---|---|---|---|---|---|
| Year |
1980 | 1981 | 1982 | 1983 | 1984 | 1985 | 1986 | 1987 | 1988 | 1989 | 1990 | 1991 | 1992 | 1993 | 1994 | 1995 | 1996 | 1997 | 1998 | 1999 |
Total |
| Total | 277 | 110 | 373 | 1122 | 1043 | 1149 | 633 | 671 | 768 | 1195 | 717 | 1021 | 1061 | 1253 | 1255 | 1247 | 918 | 972 | 1081 | 867 |
17733 |
| Single | 207 | 46 | 68 | 247 | 220 | 186 | 273 | 217 | 242 | 238 | 232 | 267 | 374 | 450 | 357 | 385 | 406 | 242 | 407 | 384 |
5448 |
| Multi | 70 | 64 | 305 | 875 | 823 | 963 | 360 | 454 | 526 | 957 | 485 | 754 | 687 | 803 | 898 | 862 | 512 | 730 | 674 | 483 |
12285 |
Fargo - Single - Multi - Family Building Permits Combined - 2006 to Current
With "New Bold Leadership In The White House And In Bismarck" The Numbers Can Only Get Better
The Phrase Was Coined By Former North Dakota GOP Governor Doug Burgum - The Only Candidate For Governor To Endorse Trump
The Current Permit Count Of 2026 Goes Back To The Low Of 1981
Number Of Permits - Time Frame One Year Candles
| Mandan Return To Top Of Page |
Link To City Of Mandan Building Permits - Mandan Building Permits - MOM
| Mandan
On realtor.com |
Mandan - Taxpayer City Equity Debt | Mandan On loopnet.com |
Mandan - Single - Multi - Family Building Permits
Number Of Permits 2005 To Current
With Five Year Average 2021 - 2025
1980 to 2026 - 46 Year Total Annual Mean Average Is 133 Units
1983 Bust to 2005 Boom - 22 Year Total Annual Mean Average Is 82 Units
2005 Boom to 2015 Bust - 11 Year Total Annual Mean Average Is 270 Units
Mandan Annual Numbers - 2020 - 2039
| 2020 - 2039 - Housing Unit Building Permits for: MANDAN, ND (Morton County) Morton County Is Not Oil Producing | |||||||||||||||||||||
|---|---|---|---|---|---|---|---|---|---|---|---|---|---|---|---|---|---|---|---|---|---|
| Year |
2020 |
2021 |
2022 |
2023 |
2024 | 2025 | 2026 | 2027 | 2028 | 2029 | 2030 | 2031 | 2032 | 2033 |
2034 |
2035 |
2036 |
2037 |
2038 |
2039 |
Total |
| Total | 95 |
110 |
53 |
75 |
52 |
105 |
12 |
502 |
|||||||||||||
| Single |
95 |
74 |
53 |
51 |
52 |
80 |
12 |
417 |
|||||||||||||
| Multi |
0 |
36 |
0 |
24 |
0 |
25 |
0 |
85 |
|||||||||||||
| 2000 - 2019 - Housing Unit Building Permits for: MANDAN, ND (Morton County) Morton County Is Not Oil Producing | |||||||||||||||||||||
|---|---|---|---|---|---|---|---|---|---|---|---|---|---|---|---|---|---|---|---|---|---|
| Year |
2000 |
2001 |
2002 |
2003 |
2004 | 2005 | 2006 | 2007 | 2008 | 2009 | 2010 | 2011 | 2012 | 2013 |
2014 |
2015 |
2016 |
2017 |
2018 |
2019 |
Total |
| Total | 70 |
79 |
183 |
166 |
173 | 160 | 280 | 246 | 116 | 62 | 100 | 224 | 478 | 635 |
448 |
223 |
248 |
153 |
114 |
181 |
4339 |
| Single |
62 |
59 |
79 |
110 |
107 | 114 | 148 | 194 | 104 | 62 | 75 | 85 | 272 | 234 |
129 |
110 |
123 |
153 |
114 |
73 |
2407 |
| Multi |
8 |
20 |
104 |
56 |
66 | 46 | 132 | 52 | 12 | 0 | 25 | 139 | 206 | 401 |
319 |
113 | 125 |
0 |
0 |
108 |
1932 |
| 1980 - 1999 - Housing Unit Building Permits for: MANDAN, ND (Morton County) Morton County Is Not Oil Producing | |||||||||||||||||||||
|---|---|---|---|---|---|---|---|---|---|---|---|---|---|---|---|---|---|---|---|---|---|
| Year |
1980 | 1981 | 1982 | 1983 | 1984 | 1985 | 1986 | 1987 | 1988 | 1989 | 1990 | 1991 | 1992 | 1993 | 1994 | 1995 | 1996 | 1997 | 1998 | 1999 |
Total |
| Total | 101 | 29 | 14 | 62 | 47 | 23 | 6 | 52 | 13 | 26 | 53 | 72 | 100 | 77 | 117 | 82 | 105 | 81 | 109 | 108 |
1277 |
| Single | 37 | 29 | 14 | 35 | 33 | 12 | 6 | 21 | 13 | 22 | 53 | 56 | 88 | 65 | 113 | 78 | 75 | 53 | 69 | 60 |
932 |
| Multi | 64 | 0 | 0 | 27 | 14 | 11 | 0 | 31 | 0 | 4 | 0 | 16 | 12 | 12 | 4 | 4 | 30 | 28 | 40 | 48 |
345 |
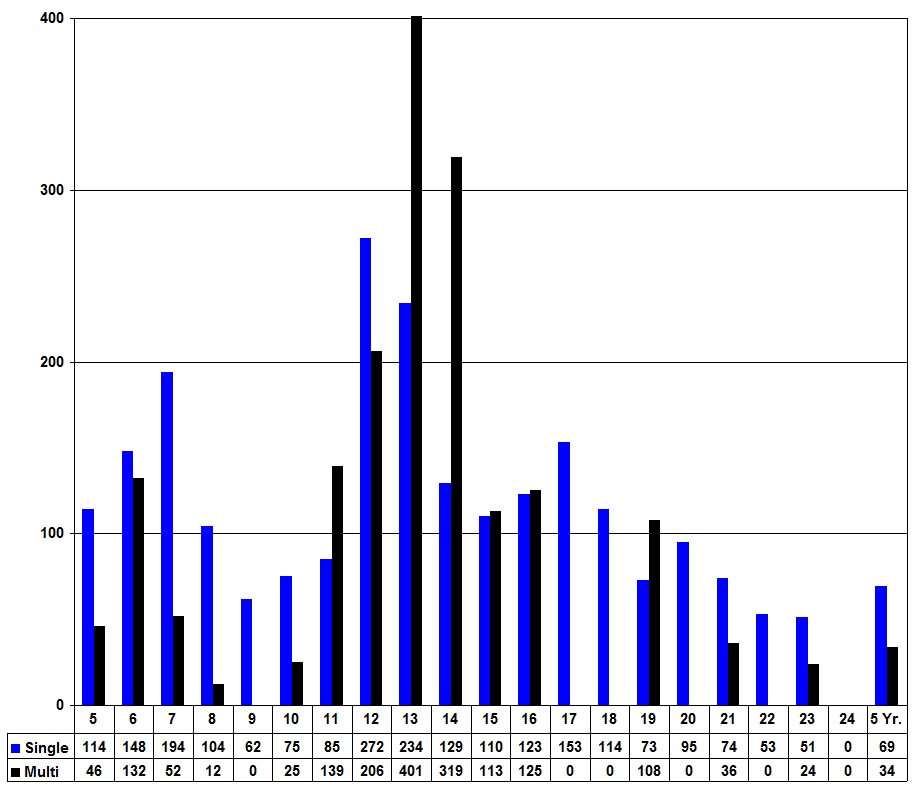
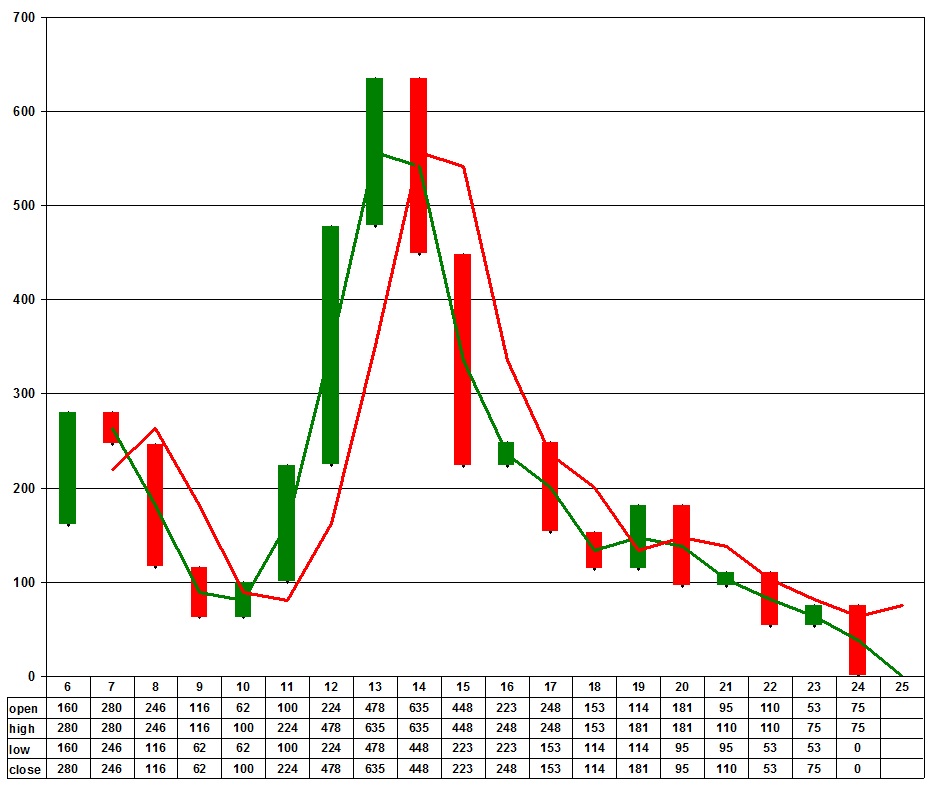
Mandan Single Multi Family Permits Combined - 2006 to Current
With "New Bold Leadership In The White House And In Bismarck" The Numbers Can Only Get Better
The Phrase Was Coined By Former North Dakota GOP Governor Doug Burgum - The Only Candidate For Governor To Endorse Trump
The Current Permit Count Of 2026 Goes Back To The Low Of 1988
Number Of Permits - Time Frame One Year Candles
YOY 2013-2014 Single Down 14% - YOY 2014-2015 Single Down 46% - YOY 2015-2016 - Single Up 1% - YOY 2016-2017 Single Down 11%
YOY 2017-2018 Single Up 20% - YOY 2018-2019 Single Down 25% - YOY 2019-2020 Single Down 36% - YOY 2020-2021 Single Up 23%
YOY 2021-2022 Single Down 22% - YOY 2022-2023 Single Down 29% - YOY 2023-2024 Single Down 4% - YOY 2024-2025 Single Up 2%
YOY 2025-2026 Single Up 34%
YOY 2026 - 2027 - 5 Months Single Family Permits Down 43 Units
YOY 2013-2014 Multi Up 39% - YOY 2014-2015 Multi Down 12% - YOY 2015-2016 - Multi Down 68% - YOY 2016-2017 Multi Down 11%
YOY 2017-2018 Multi Down 125% - YOY 2018-2019 Multi Down 0% - YOY 2019-2020 Multi Up 108% - YOY 2020-2021 Multi Down 0%
YOY 2021-2022 Multi Down 67% - YOY 2022-2023 Multi Down 36% - YOY 2023-2024 Multi Down 100% - YOY 2024-2025 Multi Up 100%
YOY 2025-2026 Multi Up 25%
YOY 2026 - 2027 - 5 Months Multi Family Permits Up 0 Units
See Cumulative Charts At Top Of Page For YOY Percentage Of Bakken Building Permits - The Numbers & Charts Pretty Much Tell The Story
Mandan 2026
| Housing Unit Building Permits for: MANDAN, ND (Morton County) Morton County Is Not Oil Producing | |||||||||||||
|---|---|---|---|---|---|---|---|---|---|---|---|---|---|
| Month Year |
Jan. 2026 |
Feb. 2026 |
Mar. 2026 |
Apr. 2026 |
May 2026 |
June 2026 |
July 2026 |
Aug. 2026 |
Sep. 2026 |
Oct. 2026 |
Nov. 2026 |
Dec. 2026 |
Total 2026 |
| Total | 0 |
3 |
1 |
3 |
5 |
12 |
|||||||
| Single |
0 |
3 |
1 |
3 |
5 |
12 |
|||||||
| Multi |
0 |
0 |
0 |
0 |
0 |
0 | |||||||
| Housing Unit Building Permits for: MANDAN, ND (Morton County) Morton County Is Not Oil Producing | |||||||||||||
|---|---|---|---|---|---|---|---|---|---|---|---|---|---|
| Month Year |
Jan. 2025 |
Feb. 2025 |
Mar. 2025 |
Apr. 2025 |
May 2025 |
June 2025 |
July 2025 |
Aug. 2025 |
Sep. 2025 |
Oct. 2025 |
Nov. 2025 |
Dec. 2025 |
Total 2025 |
| Total | 1 |
25 |
2 |
10 |
17 |
20 |
5 |
3 |
10 |
6 |
3 |
0 |
105 |
| Single |
1 |
0 |
2 |
10 |
17 |
20 |
5 |
3 |
10 |
6 |
3 |
0 |
80 |
| Multi |
0 |
25 |
0 |
0 |
0 |
0 |
0 |
0 |
0 |
0 |
0 |
0 |
25 |
| Housing Unit Building Permits for: MANDAN, ND (Morton County) Morton County Is Not Oil Producing | |||||||||||||
|---|---|---|---|---|---|---|---|---|---|---|---|---|---|
| Month Year |
Jan. 2024 |
Feb. 2024 |
Mar. 2024 |
Apr. 2024 |
May 2024 |
June 2024 |
July 2024 |
Aug. 2024 |
Sep. 2024 |
Oct. 2024 |
Nov. 2024 |
Dec. 2024 |
Total 2024 |
| Total | 0 |
0 |
0 |
11 |
4 |
5 |
6 |
8 |
9 |
6 |
3 |
0 |
52 |
| Single |
0 |
0 |
0 |
11 |
4 |
5 |
6 |
8 |
9 |
6 |
3 |
0 |
52 |
| Multi |
0 |
0 |
0 |
0 |
0 |
0 |
0 |
0 |
0 |
0 |
0 |
0 |
0 |
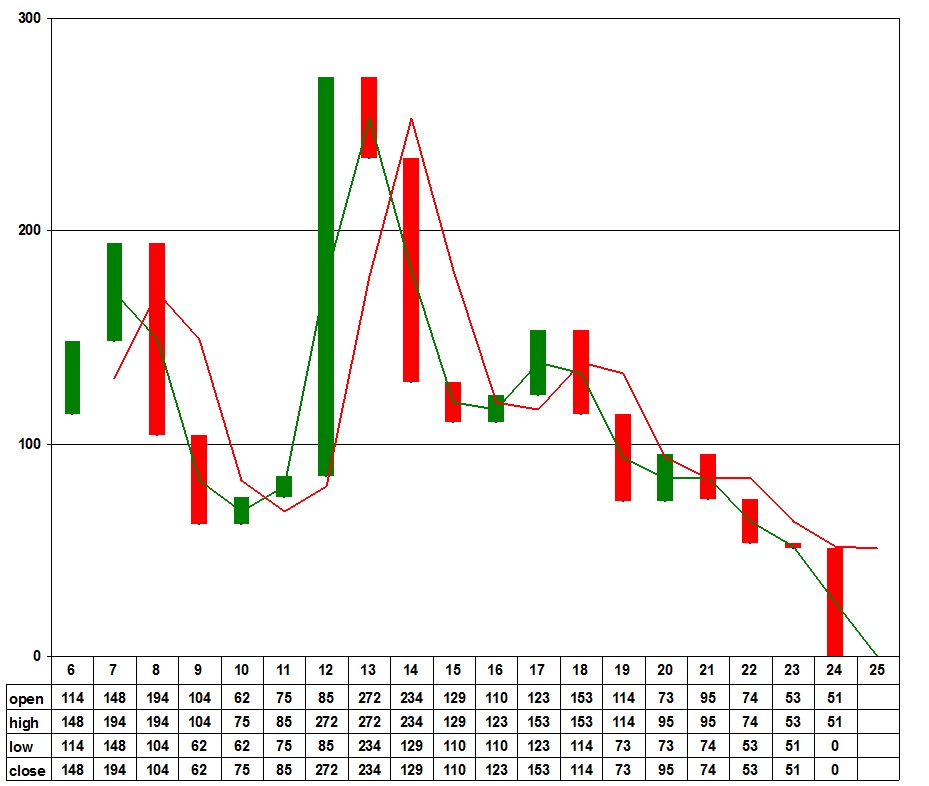
Mandan Single Family Permits - 2006 to Current
Number Of Permits - Time Frame One Year Candles
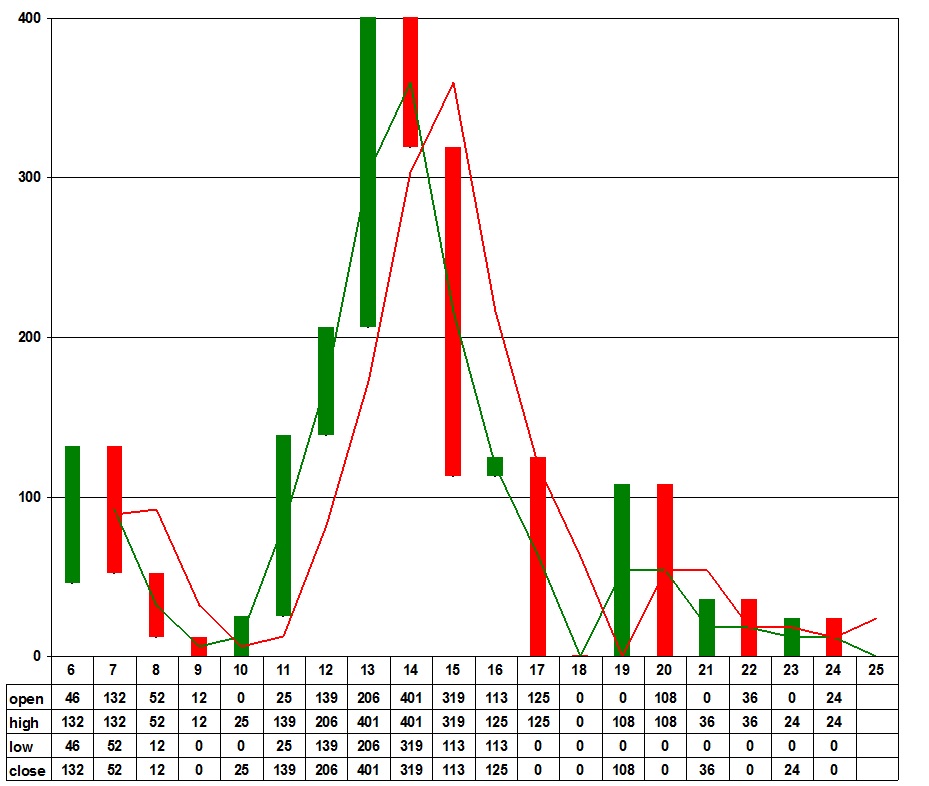
Mandan Multi Family Permits - 2006 to Current
Number Of Permits - Time Frame One Year Candles
| Watford City Return To Top Of Page |
Link To Watford City Building Permits - Watford City Building Permits - MOM
The powers that be have switched to undefined data for permits, what a Joke, data will slowly come from US Census
| Watford
City On realtor.com |
Watford City - Taxpayer City Equity Debt | Watford City On loopnet.com |
Watford City - Single - Multi - Family Building Permits
Number Of Permits 2005 To Current
With Five Year Average 2021 - 2025
Watford City Single Family Permit Numbers From 1980 To 2019 - New Highest Number Was 25 Permits In 2011
The Previous High Was 16 In 1981 - The Bust Of The Last Oil Boom Deja Vu - 1982
Watford City Multi Family Permit Numbers From 1980 To 2019 - New Highest Number Was 126 Units In 2011
The Previous High Was 36 Units In 1981 - The Bust Of The Last Oil Boom Deja Vu - 1982
1980 to 2026 - 46 Year Total Annual Mean Average Is 67 Units
1983 Bust to 2005 Boom - 22 Year Total Annual Mean Average Is 36 Units
2005 Boom to 2015 Bust - 11 Year Total Annual Mean Average Is 240 Units
Watford City Annual Numbers - 2020 - 2039
| 2020 - 2039 - Housing Unit Building Permits for: Watford City, ND (Morton County) Morton County Is Not Oil Producing | |||||||||||||||||||||
|---|---|---|---|---|---|---|---|---|---|---|---|---|---|---|---|---|---|---|---|---|---|
| Year |
2020 |
2021 |
2022 |
2023 |
2024 | 2025 | 2026 | 2027 | 2028 | 2029 | 2030 | 2031 | 2032 | 2033 |
2034 |
2035 |
2036 |
2037 |
2038 |
2039 |
Total |
| Total | 40 |
21 |
25 |
1 |
17 |
11 |
2 |
117 |
|||||||||||||
| Single |
40 |
21 |
25 |
1 |
17 |
11 |
2 |
117 |
|||||||||||||
| Multi |
0 |
0 |
0 |
0 |
0 |
0 |
0 |
0 | |||||||||||||
|
2000 - 2019 - Housing
Unit Building Permits for: WATFORD CITY, ND (McKenzie
County) 2005
Clean Water Act Changed
|
|||||||||||||||||||||
|---|---|---|---|---|---|---|---|---|---|---|---|---|---|---|---|---|---|---|---|---|---|
| Year |
2000 | 2001 | 2002 | 2003 | 2004 | 2005 | 2006 | 2007 | 2008 | 2009 | 2010 | 2011 | 2012 | 2013 | 2014 | 2015 | 2016 | 2017 | 2018 | 2019 |
Total |
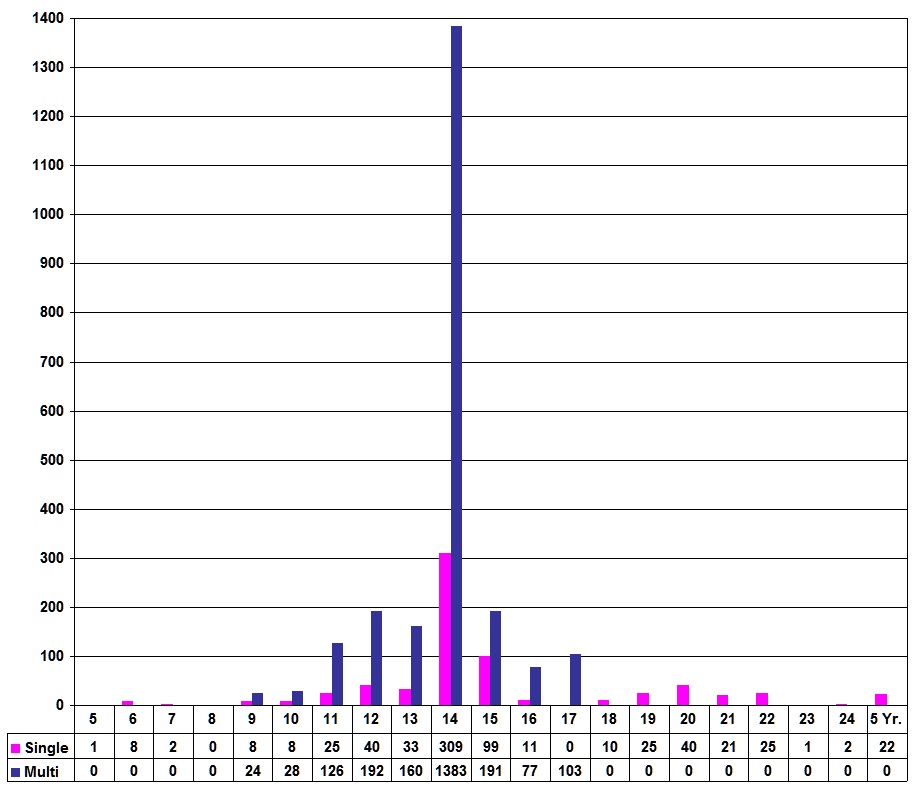
| Total | 0 | 0 | 0 | 2 | 1 | 1 | 8 | 2 | 0 | 32 | 36 | 151 | 232 | 193 | 1692 | 290 | 88 | 103 | 10 |
25 |
2866 |
| Single | 0 | 0 | 0 | 2 | 1 | 1 | 8 | 2 | 0 | 8 | 8 | 25 | 40 | 33 | 309 | 99 | 11 | 0 | 10 |
25 |
582 |
| Multi | 0 | 0 | 0 | 0 | 0 | 0 | 0 | 0 | 0 | 24 | 28 | 126 | 192 | 160 | 1383 | 191 | 77 | 103 |
0 |
0 |
2284 |
| 1980 - 1999 - Housing Unit Building Permits for: WATFORD CITY, ND (McKenzie County) | |||||||||||||||||||||
|---|---|---|---|---|---|---|---|---|---|---|---|---|---|---|---|---|---|---|---|---|---|
| Year |
1980 | 1981 | 1982 | 1983 | 1984 | 1985 | 1986 | 1987 | 1988 | 1989 | 1990 | 1991 | 1992 | 1993 | 1994 | 1995 | 1996 | 1997 | 1998 | 1999 |
Total |
| Total | 12 | 52 | 19 | 4 | 5 | 1 | 2 | 0 | 0 | 0 | 1 | 0 | 0 | 0 | 0 | 0 | 0 | 2 | 0 | 18 |
116 |
| Single | 12 | 16 | 10 | 4 | 5 | 1 | 2 | 0 | 0 | 0 | 1 | 0 | 0 | 0 | 0 | 0 | 0 | 2 | 0 | 2 |
55 |
| Multi | 0 | 36 | 9 | 0 | 0 | 0 | 0 | 0 | 0 | 0 | 0 | 0 | 0 | 0 | 0 | 0 | 0 | 0 | 0 | 16 |
61 |
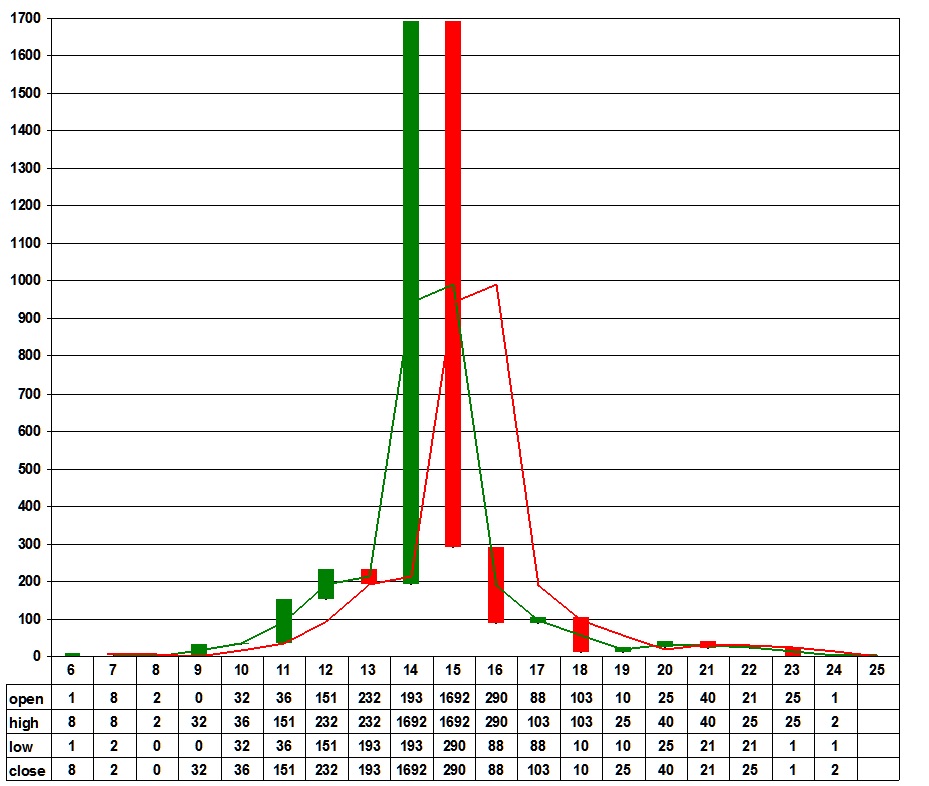
Watford City Single Multi Family Permits Combined - 2006 to Current
With "New Bold Leadership In The White House And In Bismarck" The Numbers Can Only Get Better
The Phrase Was Coined By Former North Dakota GOP Governor Doug Burgum - The Only Candidate For Governor To Endorse Trump
The Current Permit Count Of 2026 Goes Back To The Low Of 2023
Number Of Permits - Time Frame One Year Candles
YOY 2013-2014 Single Up 18% - YOY 2014-2015 Single Up 89% - YOY 2015-2016 Single Down 68% - YOY 2016-2017 - Single Down 89%
YOY 2017-2018 Single Down 99% - YOY 2018-2019 Single Up 10% - YOY 2019-2020 Single Up 60% - YOY 2020-2021 Single Up 38%
YOY 2021-2022 Single Down 67% - YOY 2022-2023 Single Up 12% - YOY 2023-2024 Single Down 100% - YOY 2024-2025 Single Up 98%
YOY 2025-2026 Single Up 36%
YOY 2026 - 2027 - 5 Months Single Family Permits Down 9 Units
YOY 2013-2014 Multi Down 17% - YOY 2014-2015 Multi Up 86% - YOY 2015-2016 Multi Down 86% - YOY 2016-2017 Multi Down 100%
YOY 2017-2018 Multi Up 25% - YOY 2018-2019 Multi Down 0% - YOY 2019-2020 Multi Down 0% - YOY 2020-2021 Multi Down 0%
YOY 2021-2022 Multi Down 0% - YOY 2022-2023 Multi Down 0% - YOY 2023-2024 Multi Down 0% - YOY 2024-2025 Multi Down 0%
YOY 2025-2026 Multi Down 0%
YOY 2026 - 2027 - 5 Months Multi Family Permits Down 0 Units
See Cumulative Charts At Top Of Page For YOY Percentage Of Bakken Building Permits - The Numbers & Charts Pretty Much Tell The Story
The powers that be have switched to undefined data for permits, what a Joke, data will slowly come from US Census
Watford City 2026
| Housing Unit Building Permits for: WATFORD CITY, ND (McKenzie County) 2005 Clean Water Act Changed | |||||||||||||
|---|---|---|---|---|---|---|---|---|---|---|---|---|---|
| Month Year |
Jan. 2026 |
Feb. 2026 |
Mar. 2026 |
Apr. 2026 |
May 2026 |
June 2026 |
July 2026 |
Aug. 2026 |
Sep. 2026 |
Oct. 2026 |
Nov. 2026 |
Dec. 2026 |
Total 2026 |
| Total | 0 |
||||||||||||
| Single |
0 |
||||||||||||
| Multi |
0 | ||||||||||||
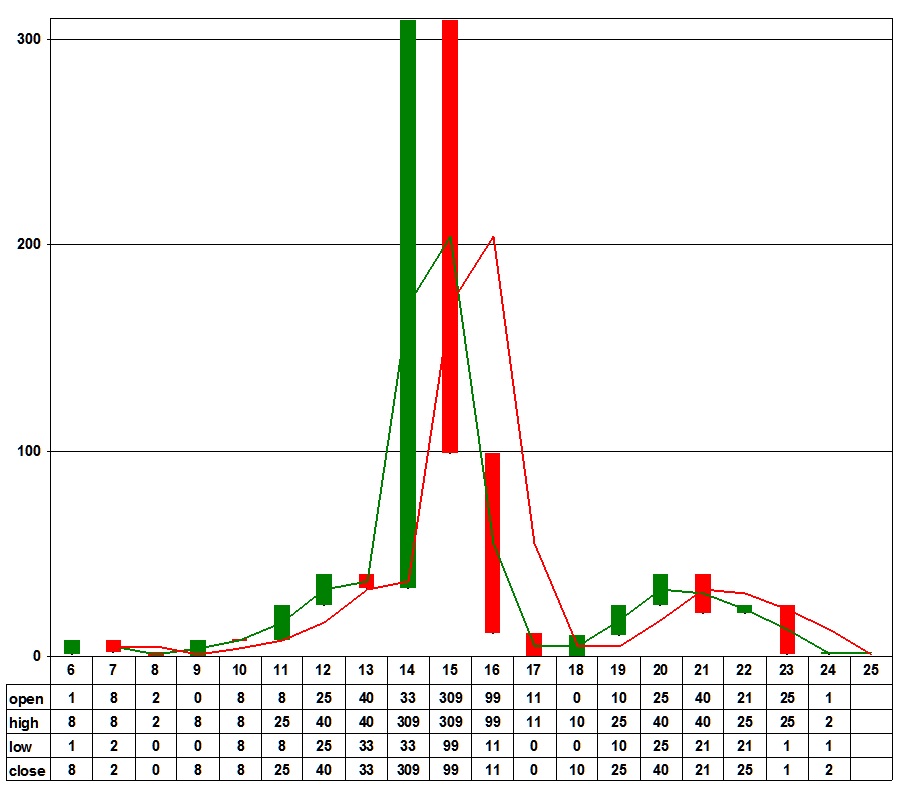
Watford City Single Family Permits - 2006 to Current
Number Of Permits - Time Frame One Year Candles
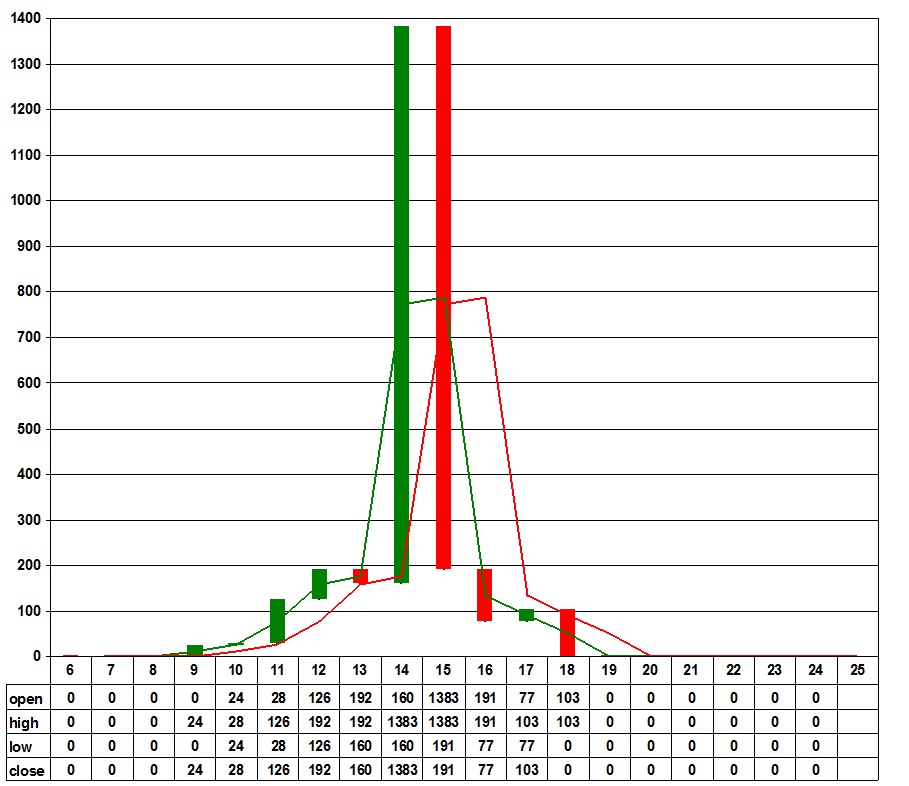
Watford City Multi Family Permits - 2006 to Current
Number Of Permits - Time Frame One Year Candles
| Newtown Return To Top Of Page |
Long Overdue - Ag - Lumber - Hardware - Retail Center
Home Town - Not Big Box Chains Made This Happen
100,000 Square Foot Store - What A Great Thing For The Area
With "New Bold Leadership In The White House And In Bismarck" The Numbers Can Only Get Better
The Phrase Was Coined By Former North Dakota GOP Governor Doug Burgum - The Only Candidate For Governor To Endorse Trump
| Ag Center Opens - Sept. 2017 | The CO-OP That Made It Happen |
| Stanley -
Tioga - Bottineau - Kenmare - Belfield Return To Top Of Page |
Belfield Mega Project Announced March 2015
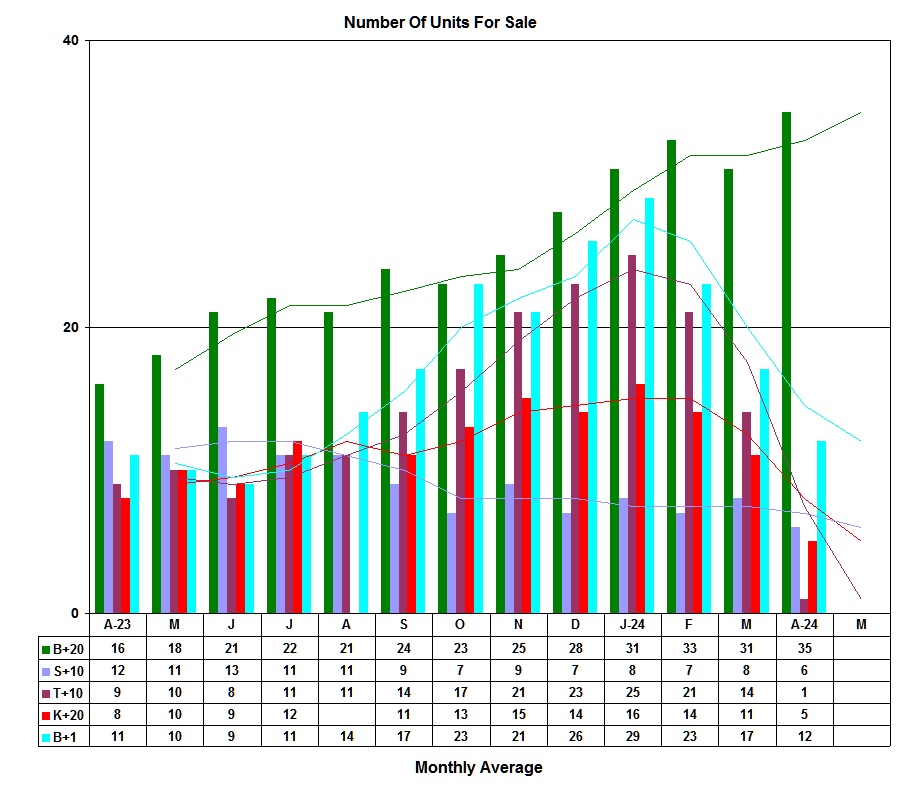
Units For Sale - Data Is From realtor.com
Bottineau + 20 Miles - Stanley & Tioga To Include 10 Miles Of Each City - 20 Miles Overlapped
Kenmare + 20 miles - Belfield + 1 Mile - Belfield Is 21 Miles From Dickinson
You Will Have To Select 1 More Filter To Choose Miles
| Bottineau On realtor.com |
Stanley On realtor.com |
Tioga On realtor.com |
Kenmare On realtor.com |
Belfield On realtor.com |
Data Is Updated Mid Month - Single Family - Condo - Townhouse - MFD Mobile Home
Bottineau B+20 - Stanley S+10 - Tioga T+10 - Kenmare K+20 - Belfield B+1
Stanley - Tioga - Bottineau - Kenmare - Belfield
Single Family Permits - Current 2005 To
With "New Bold Leadership In The White House And In Bismarck" The Numbers Can Only Get Better
The Phrase Was Coined By Former North Dakota GOP Governor Doug Burgum - The Only Candidate For Governor To Endorse Trump
| Source - hudser.org | Source - US Census Bureau |
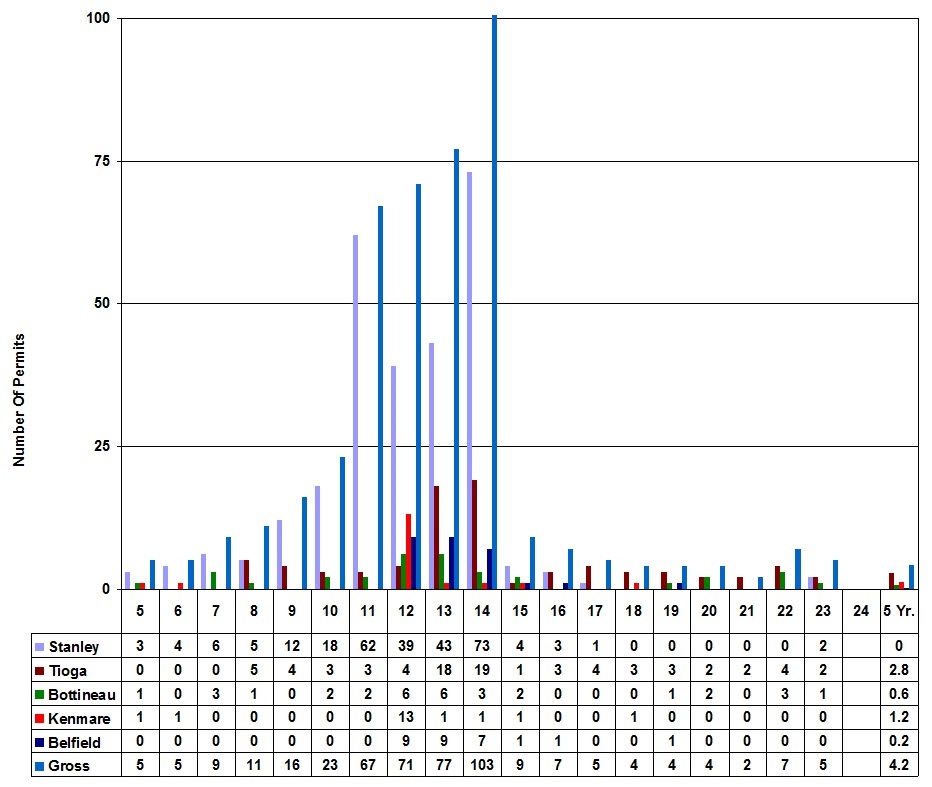
Years - With Five Year Average 2021 - 2025
Stanley - Tioga - Bottineau - Kenmare - Belfield
Multi Family Permits - Current 2005 To
With "New Bold Leadership In The White House And In Bismarck" The Numbers Can Only Get Better
The Phrase Was Coined By Former North Dakota GOP Governor Doug Burgum - The Only Candidate For Governor To Endorse Trump
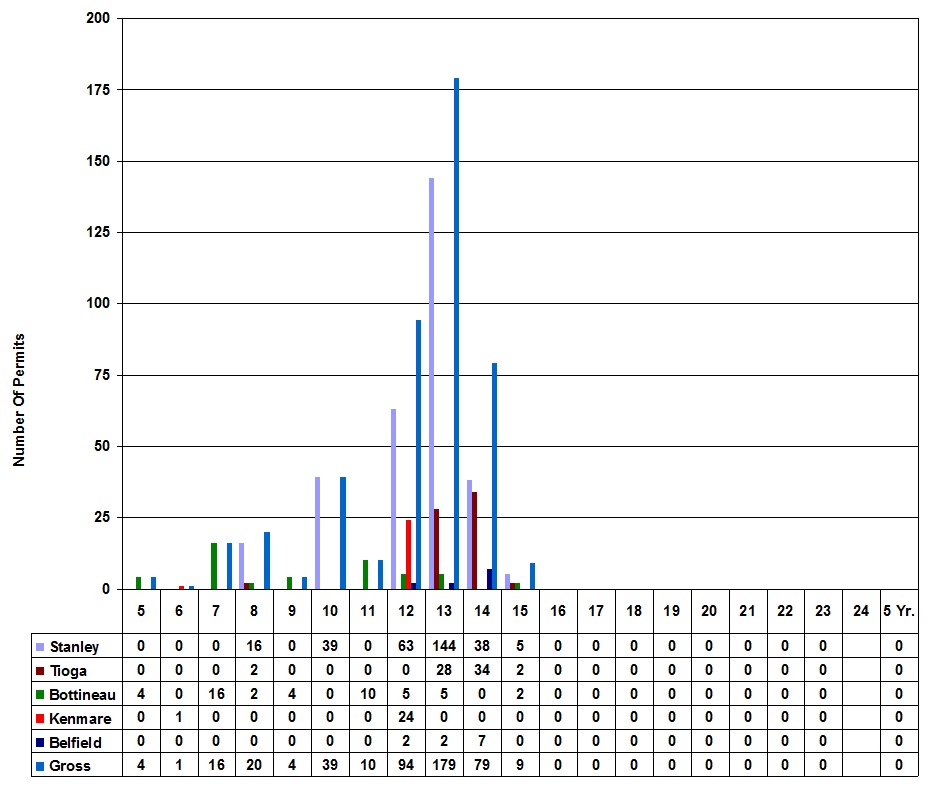
Years - With Five Year Average 2021 - 2025
1980 to 2026 - 46 Year Total Annual Mean Average Is 14.4 Units
1983 Bust to 2005 Boom - 22 Year Total Annual Mean Average Is 2 Units
2005 Boom to 2015 Bust - 11 Year Total Annual Mean Average Is 52 Units
Stanley Annual Numbers 2020 - 2059
| 2020 - 2059 - Housing Unit Building Permits for: STANLEY, ND (Mountrail County) 2005 Clean Water Act Changed | |||||||||||||||||||||||||||||||||||||||||
|---|---|---|---|---|---|---|---|---|---|---|---|---|---|---|---|---|---|---|---|---|---|---|---|---|---|---|---|---|---|---|---|---|---|---|---|---|---|---|---|---|---|
| Year |
20 | 21 | 22 | 23 | 24 | 25 | 26 | 27 | 28 | 29 | 30 |
31 | 32 | 33 | 34 | 35 | 36 | 37 | 38 | 39 | 40 | 41 | 42 | 43 | 44 | 45 | 46 |
47 |
48 |
49 |
50 |
51 |
52 |
53 |
54 |
55 |
56 |
57 |
58 |
59 |
Total |
| Total | 1 |
0 |
0 |
2 |
0 |
0 |
0 |
3 |
|||||||||||||||||||||||||||||||||
| Single |
1 |
0 |
0 |
2 |
0 |
0 |
0 |
3 |
|||||||||||||||||||||||||||||||||
| Multi | 0 |
0 |
0 |
0 |
0 |
0 |
0 |
0 |
|||||||||||||||||||||||||||||||||
| 1980 - 2019 - Housing Unit Building Permits for: STANLEY, ND (Mountrail County) 2005 Clean Water Act Changed | |||||||||||||||||||||||||||||||||||||||||
|---|---|---|---|---|---|---|---|---|---|---|---|---|---|---|---|---|---|---|---|---|---|---|---|---|---|---|---|---|---|---|---|---|---|---|---|---|---|---|---|---|---|
| Year |
80 | 81 | 82 | 83 | 84 | 85 | 86 | 87 | 88 | 89 | 90 | 91 | 92 | 93 | 94 | 95 | 96 | 97 | 98 | 99 | 00 | 01 | 02 | 03 | 04 | 05 | 06 |
07 |
08 |
09 |
10 |
11 |
12 |
13 |
14 |
15 |
16 |
17 |
18 |
19 |
Total |
| Total | 17 | 8 | 21 | 9 | 4 | 6 | 0 | 1 | 0 | 0 | 1 | 0 | 1 | 1 | 1 | 2 | 1 | 1 | 2 | 0 | 0 | 0 | 0 | 0 | 5 | 3 |
4 |
6 |
21 |
12 |
57 |
62 |
102 |
187 |
111 |
9 |
3 |
1 |
0 |
0 |
659 |
| Single |
13 | 8 | 9 | 4 | 4 | 2 | 0 | 1 | 0 | 0 | 1 | 0 | 1 | 1 | 1 | 2 | 1 | 1 | 2 | 0 | 0 | 0 | 0 | 0 | 5 | 3 |
4 |
6 |
5 |
12 |
18 |
62 |
39 |
43 |
73 |
4 |
3 |
1 |
0 |
0 |
329 |
| Multi | 4 | 0 | 12 | 5 | 0 | 4 | 0 | 0 | 0 | 0 | 0 | 0 | 0 | 0 | 0 | 0 | 0 | 0 | 0 | 0 | 0 | 0 | 0 | 0 | 0 | 0 |
0 |
0 |
16 |
0 |
39 |
0 |
63 |
144 |
38 |
5 |
0 |
0 |
0 |
0 |
330 |
1980 to 2026 - 46 Year Total Annual Mean Average Is 4.5 Units
Tioga Annual Numbers 1980 - 2026
| 1980 - 2026 - Housing Unit Building Permits for: TIOGA, ND (Williams County) 2005 Clean Water Act Changed | ||||||||||||||||||||||||||||||||||||||||||||||||
|---|---|---|---|---|---|---|---|---|---|---|---|---|---|---|---|---|---|---|---|---|---|---|---|---|---|---|---|---|---|---|---|---|---|---|---|---|---|---|---|---|---|---|---|---|---|---|---|---|
| Year |
80 | 81 | 82 | 83 | 84 | 85 | 86 | 87 | 88 | 89 | 90 | 91 | 92 | 93 | 94 | 95 | 96 | 97 | 98 | 99 | 00 | 01 | 02 | 03 | 04 | 05 | 06 |
07 |
08 |
09 |
10 |
11 |
12 |
13 |
14 |
15 |
16 |
17 |
18 |
19 |
20 |
21 |
22 |
23 |
24 |
25 |
26 |
Total |
| Total | 10 | 10 | 6 | 2 | 2 | 4 | 2 | 1 | 0 | 0 | 0 | 0 | 0 | 0 | 2 | 21 | 1 | 0 | 0 | 0 | 0 | 1 | 0 | 0 | 1 | 0 |
0 |
0 |
7 |
4 |
3 |
3 |
4 |
46 |
53 |
4 |
3 |
4 |
3 |
3 |
2 |
2 |
4 |
2 |
1 |
2 |
0 |
210 |
| Single |
10 | 3 |
6 |
2 | 2 | 4 | 2 | 1 | 0 | 0 | 0 | 0 | 0 | 0 | 2 | 21 | 1 | 0 | 0 | 0 | 0 | 1 | 0 | 0 | 1 | 0 |
0 |
0 |
5 |
4 |
3 |
3 |
4 |
18 |
19 |
2 |
3 |
4 |
0 |
3 |
2 |
2 |
4 |
2 |
1 |
2 |
0 |
137 |
| Multi | 0 | 7 | 0 | 0 | 0 | 0 | 0 | 0 | 0 | 0 | 0 | 0 | 0 | 0 | 0 | 0 | 0 | 0 | 0 | 0 | 0 | 0 | 0 | 0 | 0 | 0 |
0 |
0 |
2 |
0 |
0 |
0 |
0 |
28 |
34 |
2 |
0 |
0 |
0 |
0 |
0 |
0 |
0 |
0 |
0 |
0 |
0 |
73 |
1996 to 2026 - 30 Year Total Annual Mean Average Is 3.6 Units
Bottineau Annual Numbers 1996 - 2026
| 1996 - 2024 - Housing Unit Building Permits for: BOTTINEAU, ND (Bottineau County) 2005 Clean Water Act Changed | ||||||||||||||||||||||||||||||||
|---|---|---|---|---|---|---|---|---|---|---|---|---|---|---|---|---|---|---|---|---|---|---|---|---|---|---|---|---|---|---|---|---|
| Year |
96 | 97 |
98 | 99 | 00 | 01 | 02 | 03 | 04 | 05 |
06 |
07 |
08 |
09 |
10 |
11 |
12 |
13 |
14 |
15 |
16 |
17 |
18 |
19 |
20
|
21 |
22 |
23 |
24 |
25 |
26 |
Total |
| Total | 2 |
1 |
0 |
0 |
1 |
12 |
1 |
0 |
8 |
5 |
0 |
19 |
3 |
2 |
2 |
11 |
11 |
15 |
3 |
4 |
0 |
0 |
0 |
1 |
2 |
0 |
3 |
1 |
0 |
0 |
0 |
107 |
| Single | 2 |
1 |
0 |
0 |
1 |
0 |
0 |
0 |
2 |
1 |
0 |
3 |
1 |
2 |
2 |
6 |
6 |
6 |
3 |
2 |
0 |
0 |
0 |
1 |
2 |
0 |
3 |
1 |
0 |
0 |
0 |
45 |
| Multi | 0 |
0 |
0 |
0 |
0 |
12 |
0 |
0 |
6 |
4 |
0 |
16 |
2 |
0 |
0 |
5 |
5 |
9 |
0 |
2 |
0 |
0 |
0 |
0 |
0 |
0 |
0 |
0 |
0 |
0 |
0 |
62 |
1980 to 2026 - 46 Year Total Annual Mean Average Is 6.4 Units
Kenmare Annual Numbers 1980 - 2026
| 1980 - 2026 - Housing Unit Building Permits for: KENMARE, ND (Ward County) 2005 Clean Water Act Changed | ||||||||||||||||||||||||||||||||||||||||||||||||
|---|---|---|---|---|---|---|---|---|---|---|---|---|---|---|---|---|---|---|---|---|---|---|---|---|---|---|---|---|---|---|---|---|---|---|---|---|---|---|---|---|---|---|---|---|---|---|---|---|
| Year |
80 | 81 | 82 | 83 | 84 | 85 | 86 | 87 | 88 | 89 | 90 | 91 | 92 | 93 | 94 | 95 | 96 | 97 | 98 | 99 | 00 | 01 | 02 | 03 | 04 | 05 | 06 |
07 |
08 |
09 |
10 |
11 |
12 |
13 |
14 |
15 |
16 |
17 |
18 |
19 |
20 |
21 |
22 |
23 |
24 |
25 |
26 |
Total |
| Total | 3 | 10 | 2 | 6 | 4 | 5 | 4 | 4 | 5 | 5 | 5 | 5 | 2 | 2 | 17 | 19 | 23 | 21 | 21 | 29 | 23 | 30 | 1 | 1 | 1 | 1 |
1 |
0 |
0 |
0 |
0 |
0 |
37 |
1 |
1 |
1 |
0 |
0 |
1 |
0 |
0 |
0 |
0 |
0 |
0 |
0 |
0 |
296 |
| Single |
3 | 4 | 2 | 6 | 4 | 5 | 4 | 4 | 5 | 5 | 5 | 5 | 2 | 2 | 3 | 3 | 4 | 4 | 5 | 5 | 5 | 5 | 1 | 1 | 1 | 1 |
1 |
0 |
0 |
0 |
0 |
0 |
13 |
1 |
1 |
1 |
0 |
0 |
0 |
0 |
0 |
0 |
0 |
0 |
0 |
0 |
0 |
112 |
| Multi | 0 | 6 | 0 | 0 | 0 | 0 | 0 | 0 | 0 | 0 | 0 | 0 | 0 | 0 | 14 | 16 | 19 | 17 | 16 | 24 | 18 | 25 | 0 | 0 | 0 | 0 |
0 |
0 |
0 |
0 |
0 |
0 |
24 |
0 |
0 |
0 |
0 |
0 |
0 |
0 |
0 |
0 |
0 |
0 |
0 |
0 |
0 |
184 |
1980 to 2026 - 46 Year Total Annual Mean Average Is 2.3 Units
Belfield Annual Numbers 1980 - 2026
| 1980 - 2026 - Housing Unit Building Permits for: BELFIELD, ND (Stark County) 2005 Clean Water Act Changed | ||||||||||||||||||||||||||||||||||||||||||||||||
|---|---|---|---|---|---|---|---|---|---|---|---|---|---|---|---|---|---|---|---|---|---|---|---|---|---|---|---|---|---|---|---|---|---|---|---|---|---|---|---|---|---|---|---|---|---|---|---|---|
| Year |
80 | 81 | 82 | 83 | 84 | 85 | 86 | 87 | 88 | 89 | 90 | 91 | 92 | 93 | 94 | 95 | 96 | 97 | 98 | 99 | 00 | 01 | 02 | 03 | 04 | 05 | 06 |
07 |
08 |
09 |
10 |
11 |
12 |
13 |
14 |
15 |
16 |
17 |
18 |
19 |
20 | 21 |
22 |
23 |
24 |
25 |
26 |
Total |
| Total | 10 | 8 | 19 | 6 | 15 | 0 | 1 | 0 | 0 | 0 | 1 | 0 | 0 | 0 | 0 | 0 | 4 | 0 | 4 | 0 | 1 | 3 | 0 | 0 | 0 | 0 |
0 |
0 |
0 |
0 |
0 |
0 |
11 |
11 |
7 |
1 |
1 |
0 |
0 |
1 |
0 |
0 |
0 |
0 |
0 |
2 |
0 |
105 |
| Single |
10 | 8 | 19 | 6 | 15 | 0 | 1 | 0 | 0 | 0 | 1 | 0 | 0 | 0 | 0 | 0 | 4 | 0 | 4 | 0 | 1 | 3 | 0 | 0 | 0 | 0 |
0 |
0 |
0 |
0 |
0 |
0 |
9 |
9 |
7 |
1 |
1 |
0 |
0 |
1 |
0 |
0 |
0 |
0 |
0 |
2 |
0 |
101 |
| Multi | 0 | 0 | 0 | 0 | 0 | 0 | 0 | 0 | 0 | 0 | 0 | 0 | 0 | 0 | 0 | 0 | 0 | 0 | 0 | 0 | 0 | 0 | 0 | 0 | 0 | 0 |
0 |
0 |
0 |
0 |
0 |
0 |
2 |
2 |
0 |
0 |
0 |
0 |
0 |
0 |
0 |
0 |
0 |
0 |
0 |
0 |
0 |
4 |
Return To Index Home Page - bakkenboomorbust.com
| Bakken
Equity Debt Loans Return To Top Of Page |
"At an extended-stay workers' complex in North Dakota, some 134 units of Strata Estate Suites were originally leased to 27 corporate tenants
including Halliburton, according to documents provided to investors. The loan was among mortgages bundled into $45 million of commercial
mortgage securities in August 2013 and sold to investors such as life insurers. The mortgage has been delinquent for 20 months" Bloomberg data show.
Darkening Mortgage Bonds
| $125
Million In ND Loans Threatened |
The Suites |
Here Is A Best Use Study From 2012 - Easy Read
The Study
"Bankers here are the first to admit they’re not terribly sophisticated. First International’s nine-member board, for instance,
includes six family members, but they must employ the same risk-management practices as any other bank".
Flashback 2013 - bankdirector.com
“We feel better about this boom,” he adds. “We don’t think this is a speculative play. This is about the long term.
The oil companies know where the oil is, and they know how to get it.”
| 2014-19-20-23-24-25
Outbound - 2015-16-17-18-21-22 Balanced Return To Top Of Page |

| Return To Top Of Page |
As A Investor One Should Always Do Due Diligence To Protect Oneself.
One Can Only Interpret The Unknown Right Hand Side Of The Chart By Gageing The Known Left Hand Side
To the fullest extent of the law, we will not be liable to any person or entity for the quality, accuracy, completeness, reliability, or timeliness of the information provided on this website,
or for any direct, indirect, consequential, incidental, special or punitive damages that may arise out of the use of information we provide to any person or entity
(including, but not limited to, lost profits, loss of opportunities, trading losses, and damages that may result from any inaccuracy or incompleteness of this information).
We encourage you to invest carefully and read investment information available at the websites of the SEC at http://www.sec.gov and FINRA at http://www.finra.org.
Equity Is Used In It's Definition - The Quality Of Being Fair & Impartial & The Value Of That Fairness & Impartiality - As In Well Managed Business Equity Debt - As In Well Managed Public Equity Debt Created By
Local, State & Federal Leaders. The Democracy That Gives Taxpayers A Say In That Equity Debt. As In New Airports, New Public Structures, New Schools, New Jails, Healthcare, Law Enforcement, Addiction Recovery,
Tax Reduction, Private Investing, More Government & Bureaucrat Waste. Thank God For Bold New Leadership That Is Of A Equity State Of Mind
No More Money Squanders, No More Career Politicians, No More Good Old Boys, No More Tilting At Windmills Whose Foundations Are Anchored In Swamps.
Just then they came in sight of thirty or forty windmills that rise from that plain. And no sooner did Don Quixote see them that he said to his squire,
"Fortune is guiding our affairs better than we ourselves could have wished. Do you see over yonder, friend Sancho, thirty or forty hulking giants?
I intend to do battle with them and slay them. With their spoils we shall begin to be rich for this is a righteous war
and the removal of so foul a brood from off the face of the earth is a service God will bless."
"New Bold Leadership In The White House And In Bismarck"
The Phrase Was Coined By Former North Dakota GOP Governor Doug Burgum - The Only Candidate For Governor To Endorse Trump
IF YOU DO NOT AGREE WITH THE
TERMS OF THIS DISCLAIMER, PLEASE EXIT THIS SITE
IMMEDIATELY. PLEASE BE ADVISED THAT YOUR CONTINUED
USE OF THIS SITE
OR THE INFORMATION
PROVIDED HEREIN SHALL INDICATE YOUR CONSENT AND
AGREEMENT TO THESE TERMS.


Honor - Respect - Freedom - Country - USA - New Bold Leadership